
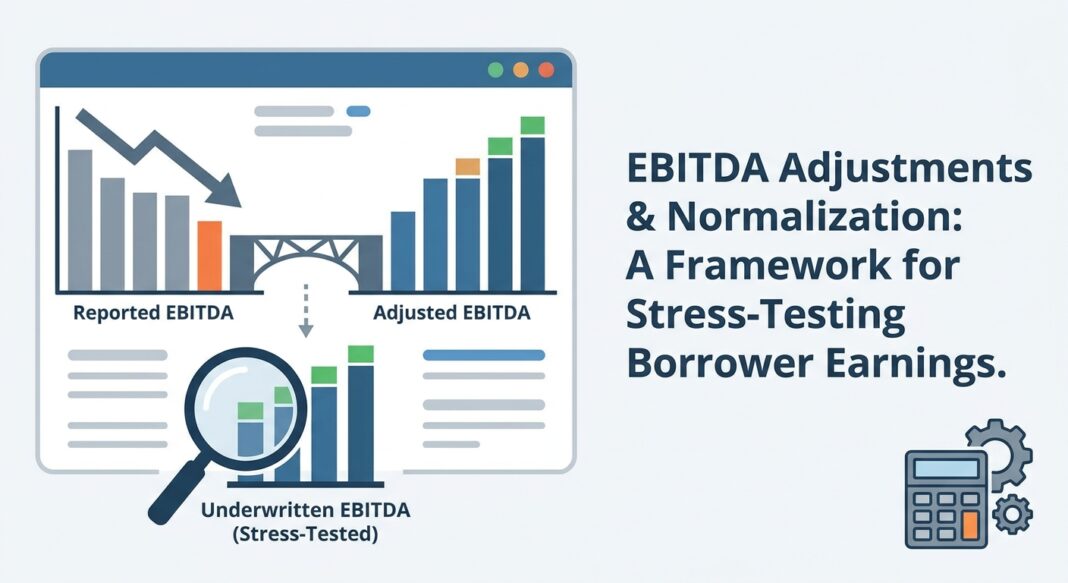
The Underwriting Challenge: When EBITDA Becomes a Negotiating Position
A manufacturing business comes to market with $8.4M in reported EBITDA. By the time the sponsor’s investment banker has finished building the adjustment schedule, the headline figure presented to lenders reads $13.1M, a 56% premium over what the income statement actually shows. The proposed leverage multiple of 4.5x looks conservative against the adjusted number. Against reported earnings, it’s 7.0x. Which figure governs your debt sizing?
This tension sits at the core of modern credit underwriting. Sponsors and lenders alike have an interest in a leverage calculation that approximates a borrower’s consistent operating cash flows, but the pressure to win deals frequently stretches that definition beyond what is defensible. Lenders are tightening underwriting standards, and in the current environment, the gap between reported and adjusted EBITDA has become a direct red flag for diligence teams evaluating deal credibility.
The lender’s job is not to accept the banker’s number. It is to build an independent, defensible earnings base: one that can withstand a revenue decline, a management transition, or a rate environment that doesn’t cooperate. This article walks through a structured, four-step framework for doing exactly that.
The Framework: The EBITDA Bridge, Reported → Adjusted → Normalized → Underwritten
Experienced underwriters distinguish between four conceptually distinct versions of EBITDA. Conflating them is one of the most common (and costly) errors in leveraged lending.
- Reported EBITDA: The GAAP-based figure from the income statement. Starting point only.
- Adjusted EBITDA: Reported EBITDA plus add-backs for non-cash, non-recurring, and transaction-related items. The seller’s preferred number.
- Normalized EBITDA: The sustainable, recurring subset of adjusted EBITDA after applying run-rate alignment, owner-compensation benchmarking, and revenue quality analysis. Normalized EBITDA is a defensible estimate of a company’s sustainable, recurring operating earnings, adjusted to remove non-recurring, non-operating, and owner-specific items while reflecting a supportable run-rate for valuation and underwriting.
- Underwritten EBITDA: The lender’s independent estimate, typically the normalized figure, stress-tested under a downside scenario and subjected to a cash conversion check.
A Quality of Earnings (QoE) analysis is the primary tool for validating the transition from reported to normalized. A QoE analysis is commonly used to test adjustments and reconcile the EBITDA bridge, reported → adjusted → normalized, to the general ledger and cash. Crucially, lenders should commission or critically review an independent QoE rather than relying on the sell-side report. The incentives are not aligned.
Lenders are usually cautious, and they’ll only consider adjustments that can be clearly justified and traced back to the company’s financial statements. They often use the most conservative EBITDA definition because it drives debt sizing, covenants, and repayment capacity.
Step 1: Classify Every Add-Back
Sort each proposed add-back into one of three buckets:
- Green-Light: Non-market owner compensation, personal expenses run through the business, one-time legal settlements, discontinued product lines, transaction fees. These are broadly accepted.
- Yellow-Light: Aggressive vendor renegotiations without executed contracts, temporary cost cuts, growth hires treated as a run-rate add-back rather than a pro forma investment. These require evidence and may be haircut.
- Red-Light: Evergreen consulting fees relabeled as one-time, recurring promotional discounts framed as margin investments, structural overhead that will return post-close. Red-light add-backs include recurring items relabeled as one-time and structural overhead that will return post-close. These should be rejected or reversed.
Step 2: Test Revenue Quality
Revenue recognition policies are frequently where earnings manipulation begins. Analyze deferred revenue schedules, contract term structures, customer concentration, and renewal rates. A business with 40% revenue concentration in one customer is not earning the same quality of income as a business with 200 customers at equivalent EBITDA.
Step 3: Benchmark Owner Compensation
Owner compensation add-backs are among the most commonly overstated items in middle-market transactions. The adjustment should reflect what a market-rate replacement CEO would cost, supported by compensation surveys, not the maximum theoretically defensible number. Not all adjustments run in the same direction: buyers sometimes make downward adjustments to remove one-time revenue or non-recurring income that inflated the seller’s trailing results.
Step 4: Reconcile to Cash
It’s essential to compare EBITDA to actual cash flow. If EBITDA goes up but the company isn’t bringing in more cash from its regular operations, that could mean the improved earnings are just on paper, from accounting changes or timing differences and not real growth. A normalized EBITDA that does not translate to operating cash flow is not underwritable.
The Analysis: A $10M EBITDA Manufacturing Company
Consider the following scenario. A sponsor-backed industrial manufacturer reports $8.4M of EBITDA on $42M of revenue. The sponsor’s QoE presents $13.1M of adjusted EBITDA after $4.7M in add-backs. The proposed total debt is $52M at a 4.0x adjusted leverage multiple. Here is how a disciplined underwriter rebuilds the number:
| Line Item | Sponsor Add-Back ($M) | Lender Haircut ($M) | Underwritten ($M) |
|---|---|---|---|
| Reported EBITDA | 8.40 | – | 8.40 |
| Owner Comp Above Market | +1.80 | (0.40) | +1.40 |
| One-Time Legal Settlement | +0.95 | – | +0.95 |
| “Recurring” IT Consulting | +0.70 | (0.70) | – |
| Cost Savings (Uncontracted) | +1.25 | (0.75) | +0.50 |
| Non-Cash Stock Comp | +0.60 | – | +0.60 |
| Downward Revenue Adjustment | – | (0.50) | (0.50) |
| Underwritten EBITDA | 13.10 | (2.35) | 11.35 |
Impact on Debt Sizing: At the sponsor’s 4.0x multiple, total debt of $52M appears reasonable. Against the underwritten EBITDA of $11.35M, the same debt stack represents 4.6x leverage: a materially different risk profile and, depending on market standards, potentially outside covenant compliance from day one.
Stress-testing then applies a downside EBITDA scenario, typically a 15–20% revenue decline, to model interest coverage under pressure. Lenders start with normalized EBITDA and then test operating cash flow, cash conversion cycle, and leverage and coverage under downside cases. In this scenario, a 20% revenue shock would reduce underwritten EBITDA to approximately $9.1M, producing a debt/EBITDA ratio of 5.7x and a likely interest coverage ratio below 1.5x, a level that would trigger financial covenant violations in most middle-market credit agreements.
Industry Standards: What the Credit Data Shows
The stakes of getting EBITDA normalization wrong are not academic. The credit cycle has exposed exactly what happens when underwriting is anchored to earnings figures that cannot withstand stress.
📊 Credit Performance Data Box
- Leveraged Loan Default Rate (Moody’s, 2025 forecast): The leveraged loan default rate is projected to end 2025 at 7.5%, nearly double the 3.4% historical average.
- Distressed Exchange Share: Distressed exchanges accounted for 64% of all defaults in the first half of 2025, about the same pace as all of 2024, which itself was the highest annual share on record.
- Private Credit Defaults: U.S. private credit defaults rose to 5.5% in Q2 2025, up from 4.5% in Q1, reflecting stress in privately placed corporate debt.
- First-Lien Recovery Advantage: Senior secured bank loans have an average discounted recovery of 79%, versus 49% for bonds. Structural seniority is not a substitute for sound EBITDA underwriting, but it is a meaningful last line of defense.
- Repeat Defaults: 35% of distressed exchanges led to repeat defaults within 48 months, a direct indictment of deals underwritten to inflated earnings that could not support the debt load even after restructuring.
- High-Yield Bond Default Rate: High-yield bond issuers are projected to see a realized default rate of 3.2% for calendar year 2025, rising above 4% by Q1 2026, still below the 4.5% historical average, but directionally consistent with tightening credit conditions.
The common denominator in leveraged credit stress: The loan market exhibited the most distress, particularly borrowers with loan-only capital structures backed by private equity firms. These are precisely the structures where aggressive EBITDA normalization, compounded by thin debt cushions, leaves lenders most exposed.
Private credit lenders in 2026 are not simply allocating capital; they are underwriting conviction. The shift from reported profitability to cash flow credibility is the defining discipline of the current credit cycle. What matters is not just how much cash a business generates, but how predictable that cash is over time.
Underwriting Checklist: EBITDA Normalization Diligence
The following checklist reflects institutional-grade diligence standards for EBITDA review in middle-market and leveraged credit transactions.
Documentation Requirements
- ☐ Three years of audited or reviewed financial statements (GAAP basis)
- ☐ Trailing twelve-month (TTM) management accounts reconciled to the most recent audit
- ☐ Independent buy-side QoE report (not the sell-side banker’s version)
- ☐ General ledger tie-out for each proposed add-back exceeding $100K
- ☐ Executed contracts, invoices, or payroll records supporting pro forma adjustments
- ☐ Working capital analysis and cash conversion cycle history (24+ months)
Questions to Ask Management
- ☐ For each add-back: Has this type of expense ever recurred within the prior three years?
- ☐ What would a market-rate replacement management team cost annually, including all benefits?
- ☐ For cost-saving add-backs: What is the implementation timeline and who is accountable?
- ☐ How does reported EBITDA compare to operating cash flow over the same period, and what explains the gap?
- ☐ Are there any pending litigation, tax, or regulatory contingencies not captured in the financials?
Analytical Tests
- ☐ Cash Conversion Check: Verify that normalized EBITDA converts to free cash flow at a rate consistent with industry norms for the sector. A manufacturing business converting less than 60% of EBITDA to FCF warrants deep explanation.
- ☐ Add-Back Concentration Test: If a single add-back represents more than 25% of the total adjustment, flag it for independent verification.
- ☐ Year-Over-Year Consistency: Recast three years of EBITDA using only the proposed adjustments. If normalized EBITDA is more volatile than reported EBITDA, the add-backs are not reducing noise; they are adding it.
- ☐ Downside Scenario: Model a 15% and 25% EBITDA decline. Confirm that the resulting coverage ratios remain above covenant minimums and that cash interest can be serviced without drawings on the revolver.
Key Takeaways
- 🔵 The EBITDA bridge is a credit thesis, not an accounting exercise. Every add-back represents an assertion about future earnings power. Underwriters must independently validate each assertion, or reject it.
- 🔵 Normalized EBITDA and adjusted EBITDA are not the same number. Adjusted EBITDA is what the banker wants you to lend against. Normalized EBITDA (the sustainable, recurring subset) is what actually services debt. The difference between them is your underwriting risk.
- 🔵 Cash conversion is the ultimate test. An EBITDA figure that does not translate to operating cash flow is not lendable. Reconcile to the cash flow statement before finalizing any underwritten earnings base.
- 🔵 Stress-test the downside before you size the debt. With the Moody’s-tracked leveraged loan default rate near 7.5% and repeat defaults following 35% of restructurings, the question is not whether a downside scenario can occur; it is whether your structure survives it.
- 🔵 Structural seniority matters, but it is not a substitute for earnings discipline. Senior secured first-lien recoveries have historically outperformed subordinated debt, but recovery rates deteriorate sharply in loan-only capital structures with thin debt cushions. The best risk management begins at the underwriting table, not the restructuring table.


