
The Underwriting Question Every Lender Must Answer First
A borrower walks into credit committee with a Confidential Information Memorandum showing $10M of Adjusted EBITDA, 3.5x senior leverage, and a 2.8x interest coverage ratio. The model appears to clear every policy threshold. But before a single covenant is drafted or a term sheet is issued, the credit team must answer one foundational question: Is this EBITDA real?
EBITDA adjustments sit at the center of nearly every private credit and leveraged finance transaction. They determine deal size, pricing, covenant headroom, and, when things go wrong, recovery outcomes. Yet the gap between what a borrower reports, what management proposes, and what a lender should actually accept can be substantial. In middle-market transactions especially, that gap can quietly transform a manageable 3.5x credit into a stressed 4.4x exposure before closing documents are even signed.
This article presents a structured underwriting framework for EBITDA normalization: covering the four-layer earnings architecture, the mechanics of acceptable add-backs, step-by-step lender analysis, common red flags, and the covenant design guardrails that protect lenders from earnings inflation over the life of a loan.
The Four-Layer EBITDA Architecture
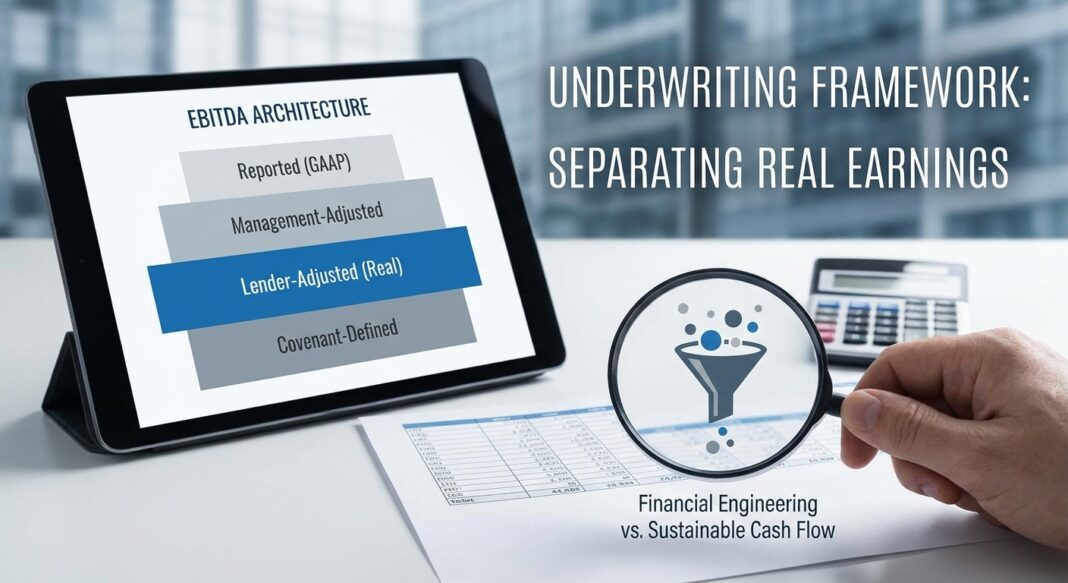
Sophisticated credit underwriters recognize that EBITDA is not a single number; it is a four-layer construct, and the layer a lender accepts as the basis for underwriting drives every downstream metric.
Layer 1: Reported EBITDA
This is the accounting starting point derived directly from GAAP financial statements: net income plus interest, taxes, depreciation, and amortization. It is auditable, consistent, and conservative. It is also often the lowest number in the stack.
Layer 2: Management-Adjusted EBITDA
This reflects the seller’s or borrower’s proposed bridge: a set of add-backs management argues represent non-recurring, non-cash, or owner-specific costs. It is typically the highest number presented in a CIM and should be treated by underwriters as a starting hypothesis, not a conclusion.
Layer 3: Lender-Adjusted (Underwriter) EBITDA
This is the number that matters for credit. Lender-adjusted EBITDA reflects what the underwriter accepts after independent review. Each add-back is tested for documentation, recurrence history, and operational legitimacy. Unsupported or recurring “one-time” items are rejected. The lender-adjusted figure becomes the denominator for all leverage and coverage calculations in underwriting.
Layer 4: Covenant-Defined EBITDA
This is the contractual definition embedded in the credit agreement, and it may differ from the underwriter’s working figure. Covenant-defined EBITDA governs compliance testing, incurrence tests, and basket calculations over the loan’s life. A loose covenant definition allows the borrower to report compliance even as true earnings deteriorate. A tight definition gives the lender an enforceable early warning system.
The practical consequence of these layers is significant. Consider a borrower that reports $2.4M of management-adjusted EBITDA and requests credit at 3.5x Debt/EBITDA. If the lender removes $500,000 of unsupported add-backs during underwriting, lender-adjusted EBITDA falls to $1.9M, and leverage moves to 4.4x. That shift may change pricing, require structural enhancements, tighten covenants, or trigger a declination.
The Normalization Process: Step-by-Step Analysis
EBITDA normalization is not about maximizing the earnings figure to make a deal work. It is about identifying the company’s sustainable, recurring operating cash flow available for debt service: nothing more, nothing less. The following process applies to a representative lower middle-market manufacturing company with $10M reported EBITDA.
Step 1: Line-by-Line P&L Review (T12 Basis)
Underwriters review three to five years of monthly profit-and-loss data, plus a trailing twelve-month (T12) view used to set the run rate. The T12 basis is the market standard: data from Axial indicates that 78% of lower middle-market CIMs are underwritten to T12. The P&L review identifies expenses that do not reflect ongoing operations.
Step 2: Apply the CARVE Test to Each Proposed Add-Back
A disciplined method for evaluating adjustments is the CARVE test: each add-back must be: Cash-impacting, Auditable by source document, Real (genuinely non-recurring in history), Verifiable via invoice or board resolution, and Excluded from ongoing operations. Any add-back failing two or more CARVE criteria should be rejected or heavily discounted.
Step 3: Apply Industry-Standard Normalization Categories
The following categories represent the most common and most contested adjustments in middle-market transactions:
- Owner/Executive Compensation Normalization: Owner pays himself $80K against a market rate of $220K. The QoE reverses this, adjusting EBITDA downward by $140K, a $1.05M reduction in enterprise value at 7.5x. Every add-back must be benchmarked to BLS Occupational Employment Statistics for the relevant role.
- One-Time Legal or Professional Fees: Only accepted if the item genuinely will not recur. A “one-off” legal expense appearing in three consecutive years is not one-off; it is a recurring cost of the business.
- Stock-Based Compensation (SBC): Market posture has shifted materially. Sponsor LOIs in the lower middle market in 2026 routinely exclude all SBC add-backs, where in 2021 SBC add-backs were standard. Lenders following suit should exclude SBC unless a market-rate replacement cost is simultaneously added back.
- Pro Forma Synergies: The most speculative category. Best practice now requires that synergy add-backs be permitted in covenant calculations only if realized within 18 months of closing, with documentation reviewed by an independent accounting firm. This constrains a category that was previously subject to wide sponsor discretion.
- Restructuring and Severance Costs: Acceptable if truly non-recurring and documented. Test: has the company restructured in any prior period? If yes, these are arguably ongoing business costs.
Step 4: Construct the Bridge and Reconcile
Reconcile lender-adjusted EBITDA back to the spread financials before calculating Debt Service Coverage Ratio (DSCR), fixed charge coverage ratio (FCCR), and total leverage. The bridge document becomes the underwriting workpaper of record and the basis for covenant-level EBITDA definition negotiations.
Illustrative Normalization: $10M EBITDA Manufacturing Company
| Item | Amount ($000s) | Lender Decision |
|---|---|---|
| Reported EBITDA | $8,200 | Accepted as baseline |
| + Owner comp normalization | +$350 | Accepted (BLS benchmarked) |
| + One-time litigation settlement | +$400 | Rejected: third occurrence in 5 years |
| + Management-proposed SBC add-back | +$300 | Rejected: market standard excludes SBC |
| + Plant relocation (one-time) | +$250 | Accepted (invoice documented) |
| + Pro forma synergies (Year 2 projection) | +$800 | Rejected: no 18-month realization plan |
| Lender-Adjusted EBITDA | $8,800 | vs. $10,300 management-proposed |
The $1.5M reduction in lender-adjusted EBITDA shifts senior leverage from 3.4x to 3.9x: a meaningful difference in pricing, covenant cushion, and stress tolerance.
Industry Standards, Red Flags, and Credit Performance Data
What Institutional Lenders Require
Institutional private credit lenders have sharpened their underwriting posture materially through 2025 and into 2026. The Federal Reserve Senior Loan Officer Survey documented senior debt covenant tightening through 2025 as the credit cycle matured, forcing sponsors to underwrite to tighter adjusted EBITDA definitions. The market has moved to a more conservative posture across the board.
On add-back governance, credit agreements should cap total add-backs as a percentage of EBITDA, the market standard is 20–25% of EBITDA, while also capping each individual add-back category. A credit agreement that allows uncapped, open-ended add-back language creates material lender risk: the EBITDA definition can be inflated over time, eroding covenant protections precisely when the lender most needs them to act as an early warning mechanism.
Academic research published by the Federal Reserve Bank of St. Louis (Faria-e-Castro, Gopalan, Pal, Sanchez, and Yerramilli) found that greater use of non-GAAP EBITDA add-backs increases the likelihood of loan delinquency and default, and makes it more likely that lead arrangers reduce their loan share exposures through secondary market sales. This confirms what experienced practitioners already know: loose EBITDA definitions are not neutral; they are a measurable credit risk factor.
Red Flags: What to Watch For
- Add-backs exceeding 20–25% of reported EBITDA. Beyond this threshold, the gap between reported and lender-adjusted earnings demands special scrutiny. Lenders commonly cap pro-forma add-backs at around 20–25% of EBITDA, breaches of this range are a structural warning.
- “One-time” items appearing in multiple periods. A legal expense, restructuring charge, or IT system cost that appears in three of the last five years is not one-time. It is a recurring operating cost that management has reclassified as an add-back.
- Revenue-side add-backs without run-rate evidence. Pro forma revenue from an acquisition or new customer contract should not inflate EBITDA without at least one full quarter of verified post-close performance.
- Large SBC add-backs without replacement cost analysis. Adding back stock compensation without modeling the equivalent cash cost of replacing equity-compensated employees understates the true cost structure of the business.
- Covenant-defined EBITDA materially higher than underwriting EBITDA. A borrower whose credit-agreement EBITDA is 15–20% higher than what the lender’s underwriting model accepts is effectively operating with phantom covenant headroom from day one.
📊 Data Box: Credit Performance Context (2025–2026)
- Moody’s forecasts global speculative-grade defaults declining to approximately 3.0% (US) by October 2026, driven by supportive financing conditions and strong refinancing activity, down from a leveraged loan default rate projected at 7.9% in Q1 2026. (Source: Moody’s CLO & Leveraged Finance Outlook, December 2025)
- The U.S. private credit default rate reached 5.8% for the LTM period ending January 2026: the highest ever on record for the asset class, though partially reflecting normalization following an extended period of minimal losses. (Source: BMO Middle Market M&A Q2 2026 Quarterly Mailer)
- S&P Global Ratings estimated new first-lien debt issued in Q2 2024 carried an average estimated recovery of 61%: the lowest level since 2017, reflecting lenders’ willingness to fund riskier credits and the rise of distressed debt exchanges. (Source: S&P Global Ratings, U.S. Leveraged Finance Q2 2024)
- Moody’s estimates expected ultimate recoveries on US first-lien loans at roughly 68%, versus long-run historical experience in the high 70s, a structural decline driven by loan-heavy capital structures and covenant-lite documentation. (Source: Moody’s Ultimate Recovery Database via collateralizedloanobligations.com, June 2026)
- Buy-side QoE providers commonly disallow 10–30% of seller-proposed add-backs, and on aggressive sell-side memoranda the proportion is often higher. (Source: Papermark QoE Analysis, August 2026)
- Post-closing M&A disputes traced to EBITDA adjustment definition disagreements accounted for 18% of R&W insurance claims in the 2025 SRS Acquiom Buy-Side R&W Claims Study, confirming that imprecise add-back language creates multi-year legal exposure. (Source: Ledgerism EBITDA Adjustments Analysis, June 2026)
Underwriting Checklist: EBITDA Normalization Diligence
The following checklist reflects the documentation and analytical steps institutional lenders employ before accepting any adjusted EBITDA figure as the basis for leverage, coverage, and covenant calculations.
Documentation Requirements
- ☐ Three to five years of annual GAAP financial statements (audited preferred; reviewed at minimum)
- ☐ T12 monthly management accounts (to identify seasonality and trend breaks)
- ☐ Independent Quality of Earnings report from a recognized accounting firm, not prepared by the borrower’s own accountants
- ☐ Supporting documentation for every proposed add-back: invoices, contracts, board minutes, settlement agreements, verbal justifications are not acceptable
- ☐ Tax returns for the same periods (reconcile to P&L; discrepancies are a red flag)
- ☐ Owner/officer compensation analysis benchmarked to BLS or comparable compensation surveys
Analytical Questions to Ask at Each Stage
- ☐ Recurrence test: Has this “one-time” item appeared in any prior period? If so, how many times?
- ☐ Cash test: Is this a non-cash item, or did actual cash leave the business? (Non-cash add-backs require separate treatment)
- ☐ Run-rate test: Does lender-adjusted EBITDA represent the next twelve months realistically, or is it a backward-looking peak?
- ☐ Cap test: Do total add-backs remain within 20–25% of reported EBITDA? What is the aggregate add-back as a percentage of reported?
- ☐ Covenant alignment test: Is covenant-defined EBITDA consistent with the underwriting EBITDA? Flag any material divergence for credit committee review.
- ☐ Stress test: If lender-adjusted EBITDA declines 15–20%, does the coverage ratio fall below 1.25x? Does leverage breach the covenant threshold?
- ☐ Synergy discipline test: Are pro forma synergies limited to an 18-month realization window with independent verification?
- ☐ Covenant cap test: Does the credit agreement cap individual and aggregate add-backs by dollar amount or percentage of EBITDA?
Key Takeaways
- There is no single EBITDA. Underwriters must explicitly distinguish between reported, management-adjusted, lender-adjusted, and covenant-defined EBITDA, and base all credit decisions on lender-adjusted figures, not management’s proposed bridge.
- Add-backs are a leverage multiplier. At a 5x senior leverage ratio, a $500K unsupported add-back inflates enterprise value and debt capacity by $2.5M. The underwriter’s job is to protect against this arithmetic before commitment, not after.
- Covenant EBITDA definitions are credit protection. A credit agreement should cap total add-backs at 20–25% of EBITDA and require individual add-back documentation. Open-ended add-back language creates phantom covenant headroom from day one, academic research confirms it measurably increases default probability.
- Recovery assumptions must be stressed. With first-lien recovery estimates now near 61–68% (versus historical highs in the high 70s), underwriters cannot rely on collateral recovery to compensate for weak EBITDA discipline at origination. Earnings quality is the first and most important line of defense.
- The QoE is not optional in the current environment. With private credit default rates at record levels and 10–30% of seller-proposed add-backs routinely disallowed, an independent Quality of Earnings report is the minimum standard of care for any new money transaction in the middle market.


