
The Number Every Lender Underwrites, and Every Borrower Wants to Maximize
A middle-market manufacturer reports $9.8 million in GAAP net income before interest, taxes, depreciation, and amortization. The sponsor’s Confidential Information Memorandum presents $13.4 million in Adjusted EBITDA. The proposed debt package is $53.6 million, exactly 4.0x the adjusted figure. On a reported basis, that same debt load is 5.5x EBITDA. Which number is real? Which one should anchor the covenant package? And critically: which number survives a downturn?
EBITDA normalization sits at the intersection of valuation, leverage structuring, and credit risk. frostbrowntodd.com puts it plainly: EBITDA forms the basis for leverage ratio financial covenants in the vast majority of credit facilities, and the negotiation over its definition is fundamental to the size of the default risk of the loan. When that definition is stretched (by permissive add-backs, aspirational synergies, or recurring costs relabeled as one-time items) the lender’s credit model rests on a foundation that has never been tested by actual cash generation.
This guide builds a practitioner-level framework for independently constructing, challenging, and stress-testing the EBITDA bridge: the analytical engine behind every leverage multiple, every coverage ratio, and every covenant threshold in a credit facility.
The Analytical Framework: The Four-Layer EBITDA Bridge
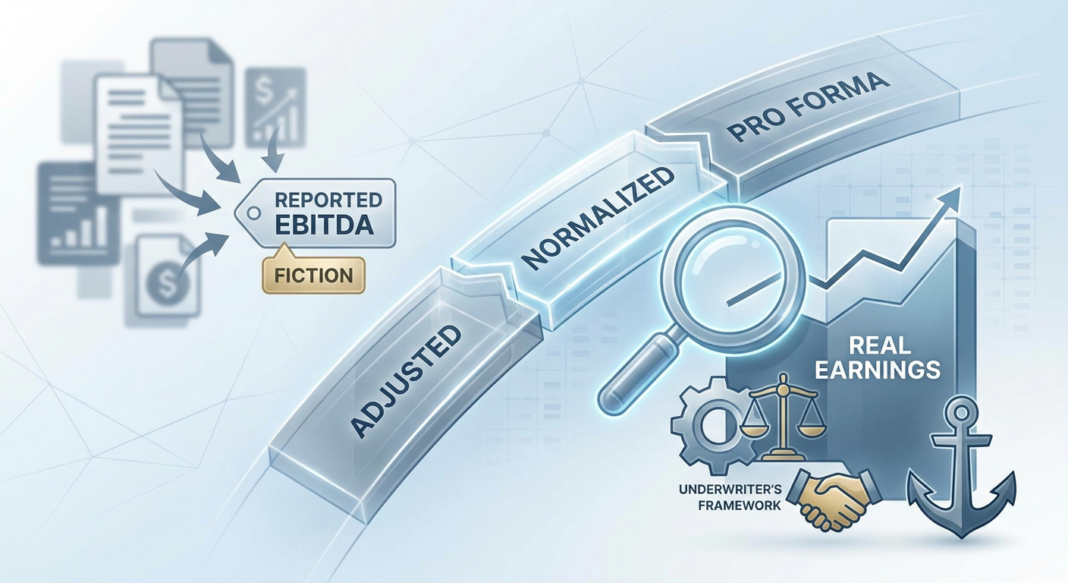
Experienced credit officers do not start with the sponsor’s Adjusted EBITDA. They start with audited financials and build their own bridge. auxocapitaladvisors.com describes the deliverable precisely: a clear EBITDA bridge, reported → adjusted → normalized → pro forma, that the credit model and covenants can be underwritten against.
Each layer in the bridge carries a distinct risk profile:
Layer 1: Reported EBITDA
The GAAP starting point: net income plus interest expense, income tax expense, depreciation, and amortization. This is the floor. It requires no credit for management judgment. It is the number the business actually generated under GAAP accounting conventions, and it is the number against which all adjustments must be measured and defended.
Layer 2: Adjusted EBITDA
The bridge from reported financials to a cleaned-up earnings figure after removing genuinely one-time and non-operating items. windsordrake.com defines this as the bridge from reported financials to a cleaned-up earnings number after removing one-time and non-operating items. Common legitimate adjustments include isolated legal settlements, non-recurring severance from a specific RIF event, and transaction fees directly tied to the financing itself. The operative test: does this item appear in the general ledger as a permanent, ongoing feature of operating the business? If yes, it is not a candidate for adjustment.
Layer 3: Normalized EBITDA
The sustainable, recurring earnings the credit model will actually underwrite. windsordrake.com draws a sharp distinction here: normalized EBITDA goes further than adjusted EBITDA to reflect the earnings a buyer can sustainably underwrite after considering steady-state staffing, market compensation, and necessary reinvestment. Critically, normalization runs in both directions. If the owner is compensated below a market replacement rate, a lender must normalize that cost upward, reducing EBITDA. If the company leases real estate from a related party at below-market rates, a market-rate adjustment reduces earnings. A credible normalized EBITDA schedule includes both add-backs and add-downs.
Layer 4: Pro Forma EBITDA
Forward-looking adjustments for specific, executed operational changes: a completed plant consolidation with documented cost evidence, a full-year run-rate for a hire tied to signed backlog, or a vendor contract renegotiation with executed agreements. Pro forma credit is not speculative. It requires offer letters, signed contracts, and documented execution timelines. Growth initiatives that have not yet produced revenue are not pro forma adjustments; they are hope.
Walking Through the Calculations: A $10M EBITDA Manufacturer
Consider a specialty manufacturer with the following sponsor-presented EBITDA bridge:
| Line Item | Sponsor Claim | Lender Assessment | Disposition |
|---|---|---|---|
| Reported GAAP EBITDA | $9.8M | $9.8M | Anchor, no adjustment |
| One-time legal settlement | +$0.6M | +$0.6M | ✅ Accepted, documented, non-recurring |
| Excess owner compensation | +$0.8M | +$0.4M | ⚠️ Partial, market replacement salary benchmarked at $400K delta |
| “Facility consolidation savings” | +$1.2M | $0 | 🚫 Rejected: no executed plan, no contracts, purely aspirational |
| Recurring consulting fees (3 consecutive years) | +$0.5M | $0 | 🚫 Rejected, evergreen item; not non-recurring |
| Below-market related-party rent (normalize up) | – | −$0.3M | ⬇️ Add-down, market rent exceeds current lease by $300K/yr |
| Lender-Normalized EBITDA | $12.9M (sponsor) | $10.5M | $2.4M gap, represents mispriced leverage |
The leverage impact is material. On a $42M debt package, the sponsor claims 3.26x leverage. The lender’s normalized view produces 4.0x. At 4.0x on a specialty manufacturer with cyclical revenue, the covenant package, amortization schedule, and revolver sizing all require recalibration. The difference is not academic; it is the distance between a defensible credit and an overleveraged one that the lender discovers only when performance weakens.
auxocapitaladvisors.com illustrates the valuation multiplier effect: at a 6.5x multiple, a difference between reported and normalized EBITDA can imply millions in enterprise value, meaning every contested add-back has compounding consequences across both the purchase price and the debt load anchored to it. Lenders who accept the sponsor’s number without independently constructing their own bridge are underwriting the seller’s optimism, not the borrower’s capacity to repay.
What Institutional Lenders See, and What Regulators Are Watching
The Add-Back Inflation Problem
natlawreview.com reports that in 2025, borrowers are continuing to push for larger EBITDA adjustments (including one-time costs, integration expenses, restructuring charges, and cost-saving initiatives) and notes that regulators like the SEC are paying closer attention. The concern is structural: S&P Global Ratings has specifically flagged that EBITDA calculations for covenant compliance purposes often include various add-backs that can obfuscate a borrower’s true earnings power, particularly in private credit structures where maintenance covenants are already set with wide headroom relative to actual performance metrics.
The Covenant-Lite Amplifier
garp.org reports that more than 80% of leveraged loans are now covenant-lite, relying on incurrence covenants rather than maintenance covenants tested at each reporting period. notveryprivateequity.com explains the structural consequence: without periodic financial ratio tests, portfolio companies that should have been restructured earlier can remain out of formal restructuring because lenders have no automatic right to intervene. When inflated EBITDA feeds into covenant definitions that are then set at wide headroom from actual performance, the result is a credit structure where the lender effectively has no early-warning mechanism at all.
Default and Distress Data Points
📊 Credit Performance Data Box
- 1.36%: Trailing 12-month conventional payment default rate for U.S. leveraged loans as of August 2025, per Pitchbook LCD. (valuationresearch.com)
- 4.37%: Combined default rate including distressed liability management exchanges (LMEs) as of the same period, nearly 3x the conventional rate. (valuationresearch.com)
- 64%: Share of all defaults in H1 2025 accounted for by distressed exchanges, matching the record pace set in full-year 2024, per Moody’s Ratings data. (moodys.com)
- ~28%: Reported average EBITDA add-back rate observed across the leveraged loan market, with 92% of companies subsequently missing their own projections. (medium.com)
- Regulatory standard: Federal banking regulators expect leveraged credits to demonstrate the ability to fully amortize senior secured debt or repay at least 50% of total debt over a five-to-seven year period from operating cash flows, a test that requires a clean, conservative EBITDA figure as its base. (federalreserve.gov)
The Lender’s Independent Duty
The OCC’s credit risk guidance is unambiguous: financial statement analysis must be sufficiently detailed to identify trends and anomalies that may affect borrower performance, and quantitative analysis of revenues, profit margins, income, cash flow, leverage, liquidity, and capitalization must be conducted rigorously. (occ.gov) pioneercapitaladvisory.com reinforces this from the practitioner side: seller-provided EBITDA schedules are a starting point, not a conclusion. Lenders independently assess every adjustment for documentation, reasonableness, and compliance with underwriting standards. Unsupported or aggressive add-backs are routinely removed.
EBITDA Normalization Underwriting Checklist
Use this checklist on every credit submission that presents an adjusted or normalized EBITDA figure. No add-back survives without documentary support tied to a specific line item in the general ledger.
- ✅ Start from audited financials, not management-prepared schedules. Reconcile the sponsor’s EBITDA bridge to the audited income statement line-by-line. Any gap between the two that cannot be traced to a specific journal entry is a red flag.
- ✅ Classify every add-back into one of three tiers. Green (objectively non-recurring: isolated legal settlements, completed transaction fees, discontinued SKUs with documented wind-down). Yellow (conditional: vendor renegotiations without signed contracts, “temporary” cost cuts, growth hires without backlog evidence). Red (reject: evergreen consulting, recurring items relabeled one-time, structural overhead that will return post-close).
- ✅ Run a three-year add-back frequency test. If the same category of expense appears as a “non-recurring” adjustment in two or more of the trailing three fiscal years, it is recurring by definition. Reject it unconditionally.
- ✅ Apply the add-down discipline. Normalize owner compensation to a verified market replacement rate. Adjust related-party lease economics to arm’s-length market rates using comparable lease data. Identify and add back any deferred maintenance or capex that has been suppressed to inflate near-term margins.
- ✅ Reconcile EBITDA to actual operating cash flow. If adjusted EBITDA growth diverges materially from operating cash flow trends over a two-year horizon, the EBITDA is capturing accounting adjustments rather than economic performance. Identify the source of divergence.
- ✅ Cap pro forma credit at executed evidence only. Accept run-rate salary savings for roles eliminated with documented severance and departure dates. Reject projected synergies, anticipated contract wins, and uncontracted vendor renegotiations.
- ✅ Anchor the covenant EBITDA definition to the lender’s normalized figure. Covenant leverage and coverage tests set against an inflated adjusted EBITDA produce a false sense of headroom. The maintenance covenant must be set against the number the credit officer is willing to defend as the borrower’s sustainable earnings capacity.
- ✅ Document the EBITDA bridge in the credit memo with full narrative support. The Basel Committee’s 2025 credit risk principles require that credit files contain all information necessary to ascertain the current financial condition of the borrower and sufficient information to track the rationale for all credit decisions. (bis.org) The EBITDA bridge, with each add-back disposition documented, is that record.
Key Takeaways
- 🔹 The sponsor’s Adjusted EBITDA is the starting point of underwriting, not the conclusion. Every add-back requires independent documentation, a non-recurrence test spanning three years of financials, and lender sign-off. Build the bridge yourself from audited statements.
- 🔹 Add-downs are as important as add-backs. Below-market related-party economics, suppressed owner compensation, and deferred maintenance capex systematically overstate reported earnings. A disciplined normalization schedule runs in both directions.
- 🔹 The gap between adjusted and normalized EBITDA is mispriced leverage. At 5x–7x valuation multiples common in middle-market transactions, a $1M overstatement in the earnings base implies $5M–$7M of incremental enterprise value, and a corresponding overstatement in debt capacity. The lender absorbs that mispricing first in a downside scenario.
- 🔹 Covenant definitions must be anchored to lender-normalized EBITDA, not sponsor-adjusted EBITDA. S&P Global has specifically flagged that loose covenant headroom, combined with permissive add-back definitions, can create structures where EBITDA has declined by nearly 40% before a maintenance covenant is triggered. That is not a protection; it is a liability.
- 🔹 EBITDA normalization connects directly to every downstream credit metric. Leverage multiples, interest coverage ratios, DSCR calculations, and debt repayment capacity tests are all downstream of a clean earnings base. A flawed EBITDA figure does not just affect one metric; it corrupts the entire credit model. Build it right at the source.


