
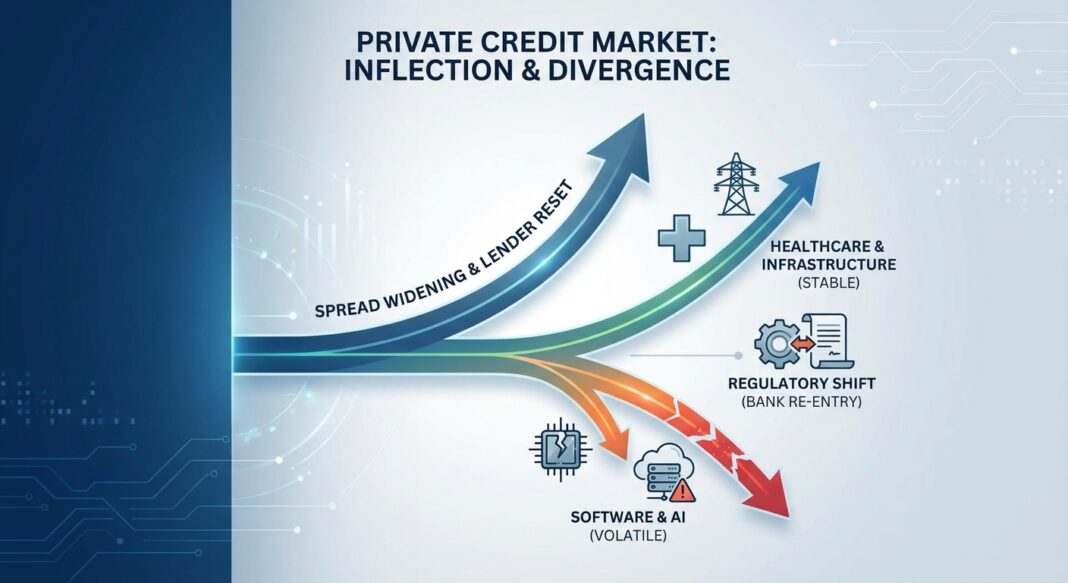
Market Headline: The Lender-Friendly Reset Is Real, But So Is the Dispersion
The U.S. private credit market has entered what practitioners are calling a “lender-friendly reset.” After a period of compressed spreads and borrower-favorable terms that characterized the 2023–2025 cycle, the confluence of Middle East geopolitical shock, AI-driven software sector repricing, and a wave of BDC redemption requests has materially shifted the negotiating balance toward disciplined lenders. According to Lord Abbett’s midyear analysis citing PitchBook data, middle market private credit spreads have widened by roughly 50 to 100 basis points since late 2025, while covenant and documentation terms have also improved for lenders.
Yet the headline spread widening obscures a more consequential story: dispersion. The market is not moving uniformly wider; it is bifurcating sharply by sector quality and vintage. Per NEPC’s Q2 2026 Private Markets Report citing PitchBook LCD, average middle market direct lending spreads moved from approximately 450 bps in Q1 2026 to approximately 500 bps in Q2 2026, while software-exposed credits are pricing at a staggering 245 bps premium over the broader B-rated loan index. Hamilton Lane confirms that private credit spreads are back in the S+500 context, up from the mid-400 bps level that defined much of 2024–2025.
Simultaneously, the regulatory backdrop has undergone its most significant structural change in over a decade. On December 5, 2025, the OCC and FDIC formally rescinded the 2013 Interagency Leveraged Lending Guidance, a rule that had constrained bank participation in leveraged markets for over a decade and that regulators themselves acknowledged had “pushed leveraged lending outside of the regulatory perimeter.” The immediate and medium-term implications for competitive dynamics between bank lenders and private credit funds are profound, and not yet fully priced into deal structures.
Quantitative Market Snapshot
The table below synthesizes key market metrics as of September 2, 2026, drawing from the most current available institutional data sources.
| Metric | Current Level (Q2/Q3 2026) | Prior Period | Change | Source |
|---|---|---|---|---|
| Middle Market Direct Lending Spreads (avg.) | ~S+500 bps | ~S+450 bps (Q1 2026) | +50 bps QoQ; +50–100 bps vs. late 2025 | NEPC / PitchBook LCD, Q2 2026 |
| High-Yield Bond Spreads (public market) | ~270 bps OAS | ~316 bps (peak H1 2026) | Compressed to near 20-year lows in early July | Bankers Edge Advisory, Aug. 2026 |
| Private Credit Yield Premium vs. High Yield | ~150–200 bps (compressed) | ~300 bps (early 2026); ~350 bps (2019) | Significant multi-year compression | Owners.pe, Apr. 2026 |
| Direct Lending Deal Volume (Q2 2026) | $33B / 149 transactions | $74.1B / 217 transactions (Q1 2026) | -55% volume QoQ; -31% deal count QoQ | PitchBook LCD via NEPC, Q2 2026 |
| Private Credit AUM & Fundraising | $2.2T+ AUM; H1 2026 fundraising a record | $1.5–2T (direct lending alone, early 2026) | Record H1 2026 closed-end fundraising per Preqin | Preqin Q2 2026 Quarterly Update; PwC/Preqin 2026 |
| Leveraged Loan TTM Default Rate | 3.8% (June 2026) | 5.1% (Feb. 2026) | Declining since Jan 2026 peak; tech sector led defaults | PitchBook LCD via NEPC, Q2 2026 |
| Private Credit Direct Lending Default Rate (Proskauer Index) | 2.73% (Q1 2026) | 1.84% (Q3 2025, two quarters prior) | +89 bps; BDC non-accruals rising (75th pct: 1.37%) | Forbes / Proskauer Index, May 2026 |
| 3-Month Term SOFR / 5-Year UST | 3.68% SOFR / 4.23% 5Y UST (June 2026) | 3.67% SOFR / 3.92% 5Y UST (March 2026) | Forward curve broadly flat; higher-for-longer bias | Valuation Research Corp., Q2 2026 |
KPI Benchmarks Lenders Are Scrutinizing
Heron Finance’s Q2 2026 benchmark analysis of 69 established private credit funds reveals that borrower interest coverage ratios (EBITDA/interest) improved year-over-year, aided by some EBITDA growth and incremental rate relief. Loan-to-value (LTV) ratios have remained stable, indicating lenders have not materially loosened underwriting standards over the past three years, a constructive sign at a late-cycle inflection. However, the share of loans performing below fund managers’ expectations increased in Q1 2026. For operators, this means lenders are demanding tighter FCCRs, typically 1.20x–1.35x minimum: particularly in volatile sectors, and are underwriting leverage multiples more conservatively, especially for AI- or tariff-exposed credits.
Sector Analysis: Appetite, Aversion, and the AI Fault Line
Healthcare: Dominant, But Reaching a Concentration Ceiling
Healthcare remains the single largest destination for U.S. direct lending capital. RSM data show healthcare accounted for approximately 22% of all direct lending issuance year-to-date through March 2026, up from 18% in full-year 2025. U.S. buyout deal value in pharma, medical, and biotech reached $78.9 billion in 2025, the second-highest total in 15 years. Yet concentration is becoming a risk factor: as of August 2026, most private credit defaults are concentrated in healthcare, and the very defensive characteristics that made the sector attractive are now creating sector-specific lender fatigue. Underwriters are demanding tighter covenants and higher FCCRs for hospital platforms and physician rollups facing reimbursement uncertainty.
Software & Technology: The Credit Fault Line
Software is the defining stress sector of 2026. Per VRC citing PitchBook LCD data as of June 19, 2026, secondary spreads in the software sector are approximately 245 bps wider than year-end levels and roughly 229 bps above the broader B-rated loan index. Software represents roughly 17% of BDC investments by deal count, per PitchBook, and UBS has warned that in an aggressive AI-disruption scenario, private credit default rates in this cohort could climb to 13%. Morgan Stanley has projected a base-case direct lending default rate of 8% concentrated in software and AI-vulnerable names, though analysts note this would be “significant but not systemic.” Lenders are now requiring explicit AI-risk assessments during underwriting of any technology-adjacent credit.
Infrastructure, Energy & Asset-Backed Finance: The New Frontier
Private credit has been leading the development of financing structures for large-scale AI-related infrastructure, and Morgan Stanley estimates private credit could supply more than half the $1.5 trillion needed for global data center buildouts through 2028. Beyond data centers, energy-transition infrastructure is attracting strong lender appetite, though Capstone Partners notes that lenders have tightened underwriting standards for energy-intensive industries exposed to oil-price volatility following the geopolitical shock of early 2026. Wellington Management notes that direct lending’s share of private credit fundraising fell to 31% by Q1 2026, with capital rotating into infrastructure debt, real estate credit, special situations, and asset-backed strategies, a structural diversification away from pure corporate direct lending.
Regulatory Catalyst: The Leveraged Lending Guidance Rescission
The OCC and FDIC rescinded the 2013 Interagency Leveraged Lending Guidance on December 5, 2025, eliminating the supervisory backstop that had effectively capped bank leverage multiples at 6x Debt/EBITDA for over a decade and that regulators acknowledged had driven leveraged lending into the non-bank private credit ecosystem. This shift is expected to foster a more competitive environment, potentially opening up deals for bank lenders that previously might have been done solely by non-bank private credit funds. However, banks may still remain constrained by capital requirements, liquidity considerations, and investor appetite for higher-leveraged structures, meaning the full competitive impact on private credit will take multiple quarters to manifest.
Implications for Borrowers and Institutional Investors
For Borrowers & Operators
The most immediate operational implication of the current environment is that access to capital has become sharply bifurcated by sector quality and financial covenant strength. Despite elevated volatility, lender demand remains strong and the market backdrop continues to favor high-quality borrowers: with higher risk premiums for AI-, tariff-, and cycle-exposed assets. Borrowers with clean FCCRs above 1.25x, stable EBITDA, and non-software/non-healthcare sector profiles will continue to access competitive pricing near S+450–475 bps. Those in disrupted sectors should anticipate spreads of S+600–750 bps, tighter covenant packages, and potentially lower leverage multiples, lenders are now applying conservative Debt/EBITDA ceilings (typically 4.5x–5.5x for core middle market) versus the 5.5x–6.5x structures common in 2022–2023. The Fed’s July 2026 SLOOS confirms that bank C&I lending standards remained basically unchanged in Q2 2026, with stronger demand from large and middle-market firms, suggesting that bank credit remains a viable parallel option, especially post-leveraged lending guidance rescission.
For Institutional Investors & Lenders
The Q2 2026 dynamic of fundraising accelerating while deployment fell by more than half, with loan origination dropping to $33.6 billion from $74.7 billion in Q1, per Preqin/PitchBook LCD data, creates a meaningful dry powder overhang. This is simultaneously a risk (pressure to deploy at potentially sub-optimal entry points) and an opportunity (managers with disciplined deal selection can be genuinely selective). As Lord Abbett notes, the most durable advantage may come from better documentation, more conservative leverage, and the time to conduct stress analysis before capital is deployed.
Portfolio surveillance is now a critical operational priority. Non-accruals, PIK usage, sector concentration, and 2021–2022 vintage exposure are the key indicators separating strong from weak portfolios. Public BDCs are now receiving an average of 8% of investment income via PIK, a metric that demands scrutiny, as elevated PIK usage can mask underlying borrower cash flow stress. Investors should also monitor the compounding effect of the April 2026 SLOOS revelation that banks tightened standards on all NDFI (non-depository financial institution) loan categories over the prior year, which increases funding cost and refinancing risk for private credit funds themselves.
Forward-Looking View: Liquidity and Lending Dynamics (Q3–Q4 2026)
The second half of 2026 is likely to be defined by dispersion across managers, sectors, and deal vintages. Several intersecting forces will shape the lending landscape:
- Rate environment: Market expectations continue to reflect a higher-for-longer rate environment, with the forward curve broadly flat as of June 2026. With SOFR at 3.68% and 5-year Treasuries at 4.23%, all-in yields for senior middle market loans remain in the 9–11% range, structurally attractive for lenders, but a sustained cash flow burden on leveraged borrowers without EBITDA growth.
- Bank re-entry: Banks began returning to the upper middle market in June 2026, contributing to increased competition and alleviating some upward spread pressure. The full effect of the leveraged lending guidance rescission will take several quarters to manifest in deal structures, but borrowers in large-cap and upper middle market should begin to see marginally improved terms.
- M&A revival: Middle market PE deal value increased approximately 10.7% year-over-year and exit activity rose 14%, with more than half of PitchBook LCD survey respondents expressing optimism about deal flow picking up over the next 90 days.
- Default trajectory: The TTM leveraged loan default rate has been declining steadily since its 5.1% January 2026 peak, reaching 3.8% in June. However, Fitch reported a 6.0% private credit default rate in April 2026, and distressed restructurings may be understating true credit deterioration. Software sector maturities in 2028–2029 remain a latent pressure point.
Key Market Insights
- Spreads have reset, but not uniformly. Middle market private credit spreads are back at S+500 bps on average, up 50–100 bps since late 2025, but software-exposed credits now trade at a 229–245 bps premium to the broader B-rated loan index, creating stark bifurcation by sector. Operators should price their refinancing assumptions accordingly.
- The deployment gap is the defining structural tension. Q2 2026 closed-end private credit fundraising hit a record H1 high, while deal origination collapsed 55% quarter-over-quarter. Managers with dry powder and discipline are in the most favored position; managers under deployment pressure may accept sub-optimal structures.
- The OCC/FDIC leveraged lending guidance rescission is a slow-burning competitive catalyst. Banks now have formal regulatory freedom to compete more aggressively in leveraged markets, but capital requirements and syndication constraints mean the competitive shift will be gradual, creating a 12–24 month window where private credit retains pricing power in the core middle market.
- FCCRs and LTVs are the new underwriting litmus tests. Stable LTV ratios across established private credit funds indicate disciplined underwriting has persisted, but rising non-accruals (BDC 75th percentile reaching 1.37%) and PIK income averaging 8% of BDC investment income signal that a meaningful subset of credits is under genuine cash flow strain. Borrowers with FCCRs below 1.20x will face structural repricing or covenant resets.
- Healthcare and infrastructure are the sector winners; software is the sector to manage down. Healthcare now commands 22% of direct lending issuance, and AI/data center infrastructure is attracting dedicated capital pools. Software credits face a structural repricing cycle driven by AI disruption risk and a 2028–2029 maturity wall, lenders must now explicitly underwrite AI displacement risk as a core credit factor, not a qualitative footnote.


