
Credit Cycle at the Crossroads: Spread Re-Pricing, Bifurcated Lender Appetite, and the KPI Discipline Reshaping Private Markets in Q4 2026
Bond Capital, Market & Sector Intelligence Desk | October 19, 2026
I. Market Headline: A Hawkish Turn Resets the Cycle
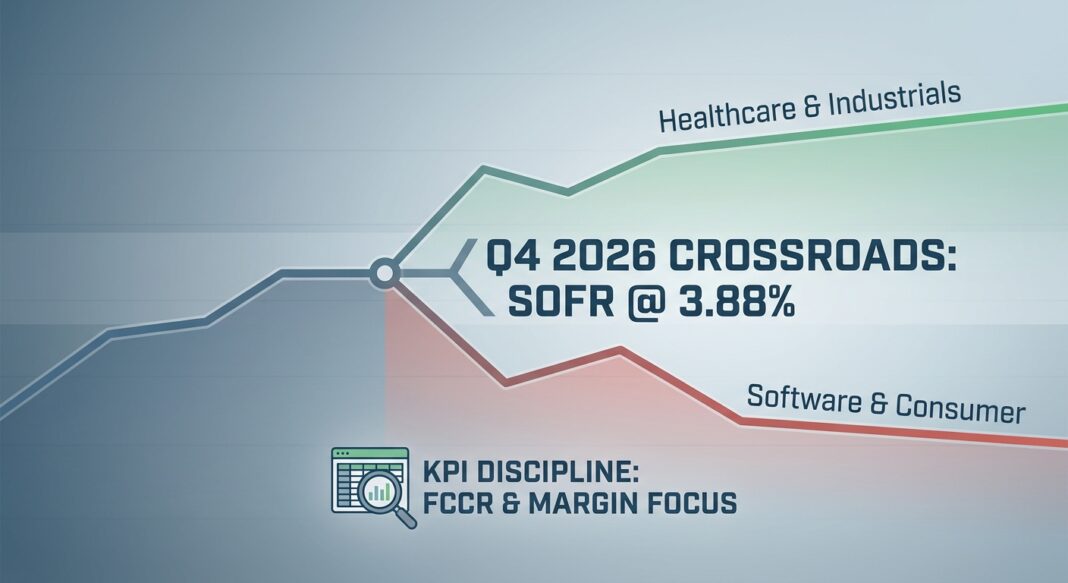
The September 2026 Federal Reserve rate hike (the first increase since 2023 and a reversal of the late-2025 easing cycle) crystallised a macro shift that credit markets had been pricing incrementally for months. With the Fed Funds target now at 3.75%–4.00% and overnight SOFR settling near 3.88%, the cost of floating-rate debt has re-accelerated. Combined with persistent geopolitical uncertainty, AI-related disruption fears, and mounting pressure on 2021–2022 vintage loans, the private credit market in Q4 2026 is navigating a genuine inflection point, not a crisis, but a credible cycle turn.
The headline story is not uniform distress. It is bifurcation at scale. Borrower performance has remained broadly resilient in healthcare, industrials, and essential services, while a concentrated cluster of software-exposed credits and highly levered roll-ups face real structural headwinds. Direct lending deal volume fell to approximately $46 billion in 1H 2026: below long-term averages, and BDC net flows turned negative as redemptions rose sharply. Yet North American dry powder still exceeds $280 billion, meaning capital exists; the question is which fund holds it and at what terms.
For institutional investors and operators, this environment demands precision: sector selection, vintage awareness, KPI positioning, and lender relationship intelligence are now primary execution variables, not peripheral considerations.
II. Quantitative Market Snapshot
The table below consolidates the most current market data available as of Q3/Q4 2026. All figures are sourced to the underlying primary publication.
| Metric | Current Value (Q3–Q4 2026) | Prior Period | Direction | Source |
|---|---|---|---|---|
| Overnight SOFR | 3.88%–3.89% | 3.50% (Jul 27, 2026 low) / 4.32% (Oct 2025) | ↑ Hiked Sept 2026 | FRED / NY Fed, Oct 16, 2026 |
| Middle Market Unitranche Coupon Spread | SOFR + 500–575 bps | SOFR + mid-400s bps (YE 2025) | ↑ ~25–50 bps wider YTD | VRC Q3 2026 Pricing Matrix |
| Middle Market Unitranche All-In Yield | High single-digit (unlevered); +35 bps vs Q2 | ~9.5%–10.5% (2023 peak) | ↑ Risen from prior-qtr lows on SOFR move | VRC Q3 2026; Northleaf Q2 2026 |
| BSL B-Rated Secondary Spread | S+412 bps (September 2026) | S+445 bps (June 2026) | ↓ Tightening from March spike | VRC Q3 2026 |
| High Yield Composite Spread (OAS) | 324 bps over Treasuries; 8.22% YTM | ~260 bps (Jan 2025 low) | ↑ Widened from cycle trough | ICE BofA US HY Index, Oct 2026 |
| Private Credit vs. HY Spread Premium | ~150–200 bps | ~350 bps (2019) | ↓ Structurally compressed | Owners.pe / LCD, Apr 2026 |
| US Sponsored Middle Market Deal Volume (1H 2026) | ~$46 billion | ~$74.56B (Q1 2026 alone) | ↓ Below long-term averages | StepStone / Preqin, Aug 2026 |
| Private Credit Default Rate (Proskauer PCDI) | 2.51% (Q2 2026) | 2.73% (Q1 2026) / 1.84% (Q3 2025) | ↓ Slight moderation but trend elevated | Proskauer, Jul 28, 2026 |
| Private Credit Default Rate (Fitch PMR, broader definition) | 6.3% (12 months through Aug 2026) | 9.2% (full-year 2025, Fitch) | → Record for Fitch series; includes maturity extensions | Fitch Ratings / VRC Q3 2026 |
| New Issue Leverage, Competitive Transactions | 5.0x–6.0x net debt/EBITDA | 6.5x–6.8x (2021–2022 vintage peak) | ↓ More conservative vs. peak; still competitive | VRC Proprietary Data, Jun 30, 2026 |
| OID (Original Issue Discount), Standard Transactions | 98.75–99.25 | 98.75–99.25 | → Unchanged | VRC Q2 2026 |
Note on default rate divergence: Proskauer counts payment and covenant defaults across ~716 loans ($195.6B principal). Fitch’s broader methodology includes distressed exchanges and maturity extensions, which accounts for the majority of the gap. Both metrics are relevant to different analytical purposes. Operators should track both series as complementary signals.
III. Regulatory & Banking Environment: A Selective Thaw With a Critical Exception
The July 2026 Federal Reserve SLOOS delivered a somewhat mixed but ultimately constructive signal for C&I borrowers: bank lending standards for commercial and industrial loans to large, middle market, and small firms remained broadly unchanged, with C&I standards described as easier than the midpoints of their historical ranges, and with significant net shares of banks reporting narrower spreads of loan rates over their cost of funds.
The critical exception is the treatment of Non-Depository Financial Institutions (NDFIs), which includes private credit funds and BDCs. The April 2026 SLOOS revealed significant net shares of banks tightening standards for NDFI loans: with higher risk premiums on riskier loans, stricter covenants, shorter maturities, stricter collateral requirements, and lower credit line ceilings all widely reported. Banks cited a less favorable economic outlook and increased borrower credit risk as primary drivers. This dynamic raises the effective cost of leverage for private credit funds themselves, adding a second-order tightening effect on deployment capacity, particularly for smaller managers without diversified funding access.
For the broader credit ecosystem, the July SLOOS confirms that standards for most other NDFI loan categories remain at the tighter ends of their historical ranges: a persistent headwind for fund-level leverage that may constrain net returns even as asset-level spreads hold.
IV. Sector Analysis: Where Capital Is Competing, and Where It Is Retreating
🟢 Healthcare: The Dominant Active Sector
Healthcare has emerged as the defining allocation story of 2026. PitchBook LCD data confirms that Healthcare displaced Technology as the sector receiving the largest share of direct lending deployment in Q1 2026, a shift that has persisted. Octus data shows healthcare led all sectors in 2025, accounting for 19% of all direct lending deals and remaining the only major industry that did not see significant year-over-year price tightening. Lender appetite is supported by non-cyclical revenue models, demographic tailwinds, and cash flow predictability, the FCCR profile disciplined lenders currently require. White & Case’s Debt Explorer notes that life sciences, contract manufacturing, and royalty-financing structures are all expanding private credit’s reach within the sector.
🟢 Industrials, Defense & Essential Services: Active Competition
CAPX’s analysis is direct: funds with deployment mandates in manufacturing, industrial, and essential services are actively seeking credits, with S&P Global’s April 2026 cross-industry analysis confirming that manufacturing, infrastructure, and essential-services credits attract active competition. These sectors benefit from tangible asset collateral, stable cash generation, and, critically, the perception of tariff and reshoring resilience that makes them thematic allocation plays in an uncertain macro environment.
🔴 Software & Legacy SaaS: Structural Pullback
No sector has faced a more significant reassessment. According to Morningstar DBRS, private credit rating downgrade volume rose 50% year-over-year through May 2026, with 42% of downgrades moving borrowers from single-B into CCC territory or lower. VRC’s Q3 2026 update confirms software and technology credits continue to price 50–100 bps wider than broader market levels. Goldman Sachs estimated that software comprises approximately 25% of direct lending assets, a concentration that is compressing fund-level performance and triggering redemption pressures across affected vehicles. PwC’s Global Private Credit Survey 2026 notes 93% of respondents expect flat or lower returns in 2026, with credit competition and defaults/losses as the top two cited factors.
🟡 Consumer, Retail & Automotive: Elevated Stress Watch
The PwC survey flags consumer and retail (cited by 56% of managers), automotive (42%), and hospitality/leisure (27%) as the sectors where stress is most expected to be acute over the next one to two years. These sectors combine cyclical sensitivity, AI-related efficiency disruption, and compressed consumer discretionary spending, a challenging combination in a higher-for-longer rate environment.
V. KPI Underwriting in 2026: FCCR Floors Rise, Leverage Discipline Returns
The stress now visible in 2021–2022 vintage loans has had a direct and measurable effect on underwriting standards. VRC’s proprietary data shows that the highest leverage levels were observed in 2021–2022 vintages at approximately 6.5x–6.8x EBITDA, while newer deals, though still competitive at 5.0x–6.0x for high-quality transactions, reflect more conservative assumptions. VRC’s Q2 2026 data documented that 2021 cohort leverage has effectively increased by approximately 0.9x through EBITDA underperformance, while adjusted cash interest coverage has declined by roughly 0.4x, confirming that the problem is not just leverage at origination but post-origination fundamental drift.
VRC’s most recent data reports current median interest coverage ratios of approximately 1.7x–1.8x across the broader portfolio, with more recent vintages reporting stronger debt-service capacity above the 2.0x historical threshold. Lenders are now actively underwriting to forward-looking Fixed Charge Coverage Ratio (FCCR) stress scenarios that incorporate base rate sensitivity, constraining available leverage multiples even before a deal is agreed.
Heron Finance’s Q2 2026 Benchmark Report, covering 69 private credit funds with over $1 trillion in aggregate AUM, confirms that borrower debt/EBITDA ratios have been broadly stable with no material upward drift, and that LTVs remain conservative, providing a meaningful first-loss cushion. However, the same report flags that fund-level debt-to-equity has risen to approximately 1.0x, warranting monitoring if leverage trends toward 1.2x as amplification risk increases during periods of market stress.
VI. Strategic & Operational Implications
For Borrowers & Operating Executives
- Sector positioning is now a financing variable. The market is bifurcated: businesses in healthcare services, manufacturing, distribution, and environmental services face active lender competition. Software-heavy companies face structural repricing and lender reticence independent of their own credit quality, fund-level stress is now a deal execution variable for performing borrowers.
- FCCR positioning matters at origination and at review. With median interest coverage across the portfolio at 1.7x–1.8x and lenders stress-testing forward-looking FCCR under higher-rate scenarios, borrowers who cannot demonstrate robust coverage at SOFR+50–100 bps will face materially tighter terms or limited availability. Proactive FCCR management (including conservative capex assumptions and earnings visibility) is a direct cost-of-capital lever.
- Refinancing windows remain open but are narrowing for weaker credits. The September 2026 Fed hike has added ~25 bps to floating-rate obligations. A $12.7B BDC maturity wall narrows refinancing bandwidth for funds managing existing portfolios, which may limit flex on terms for borrowers in constrained fund vehicles.
For Institutional Investors & Lenders
- The illiquidity premium has structurally compressed. Private credit’s spread over comparable public high yield has narrowed from ~350 bps in 2019 to approximately 150–200 bps today. At current levels, that premium is barely sufficient to compensate for illiquidity, concentration, and valuation uncertainty risks when modeled independently. Investors should demand demonstrable structural protections (covenants, seniority, and asset security) to justify the carry differential.
- BDC flow dynamics signal a prolonged redemption cycle. Goldman Sachs expects evergreen retail private credit vehicles to remain in net outflows throughout 2026 and likely 2027. StepStone’s 1H26 report confirms BDC subscriptions fell from $8.7B in Q4 2025 to $3.6B in Q2 2026 while redemptions rose sharply. Institutional LPs with closed-end mandates hold a structural advantage over evergreen retail structures in deployment discipline and liquidity management.
- Lower middle market offers structurally superior risk-adjusted entry. The LMM spread premium over large-cap direct lending widened to 232 bps in Q3 2025 as capital concentrated at the top of the market. LMM transactions continue to carry real maintenance covenants (not covenant-lite structures common in the syndicated market), providing earlier warning signals and workout optionality not available in larger credits.
VII. Forward-Looking View: The Next 3–6 Months
The September 2026 Fed hike, the first since 2023, represents a structural break in the easing narrative. With Fed Chair Warsh’s committee signaling that still-elevated inflation remains the primary risk and three dissents in July favoring a hike ahead of the September move, forward rate expectations have re-anchored upward. The 90-day SOFR of 3.73% as of mid-October remains meaningfully above the July trough, but spot SOFR at 3.88%–3.89% represents the effective floating cost for new issuances priced today.
Lord Abbett’s mid-year analysis identifies the most durable near-term advantage as coming from better loan documentation, more conservative leverage, and thorough stress analysis before capital is deployed, signaling that the market is in a lender-friendly reset, not a collapse. Northleaf’s Q2 2026 update confirms that elevated base rates combined with widened spreads continue to support high-single-digit unlevered yields, maintaining private credit’s structural return appeal.
The key risk to monitor is not aggregate default rates, which remain manageable, but the shadow default rate: VRC’s internal analysis indicates a shadow default rate exceeding 10% among currently valued portfolio investments when extended definitions (maturity extensions, PIK amendments) are applied. As the BDC maturity wall approaches and fund-level NDFI bank lending tightens, the gap between official and shadow default metrics may be forced into the open, a risk that should be priced into secondary portfolio purchases and new commitment pricing through H1 2027.
VIII. Key Market Insights: Actionable Takeaways
- SOFR at 3.88% post-September hike is the new floor assumption for deal underwriting. With the Fed Funds target at 3.75%–4.00% and further rate cuts not broadly expected, all leveraged capital structures must be stress-tested against SOFR at or above current levels through at least mid-2027. Coverage ratios underwritten to a SOFR sub-3.5% floor carry material re-pricing risk.
- The 150–200 bps private credit spread premium over high yield is now structurally thin. For investors, this gap barely compensates for illiquidity, concentration, and mark-to-model risk in a normal environment, and is insufficient in a stress scenario. Demand demonstrable seniority, covenant maintenance, and sector quality to justify illiquid allocations at current prices.
- Healthcare and industrials are the sectors of active lender competition; software and consumer are the sectors of active lender discipline. Deal terms, leverage availability, and speed of execution vary dramatically by sector. Operators should map their sector positioning explicitly before commencing a financing process in Q4 2026.
- The 2021–2022 vintage stress is the primary systemic risk vector for the next 12 months. Loans originated at 6.5x–6.8x EBITDA under near-zero rate assumptions now carry median interest coverage of 1.7x–1.8x. Maturity walls and redemption pressure on affected funds create refinancing asymmetry, quality borrowers in affected fund vehicles may face worse terms than their fundamentals warrant.
- Lower middle market credits with real covenants, asset collateral, and essential-services revenue profiles represent the best risk-adjusted entry point in this environment. LMM spreads remain 200+ bps above large-cap direct lending with stronger structural protections, at a moment when the large-cap market is absorbing the first wave of credit cycle normalization.


