
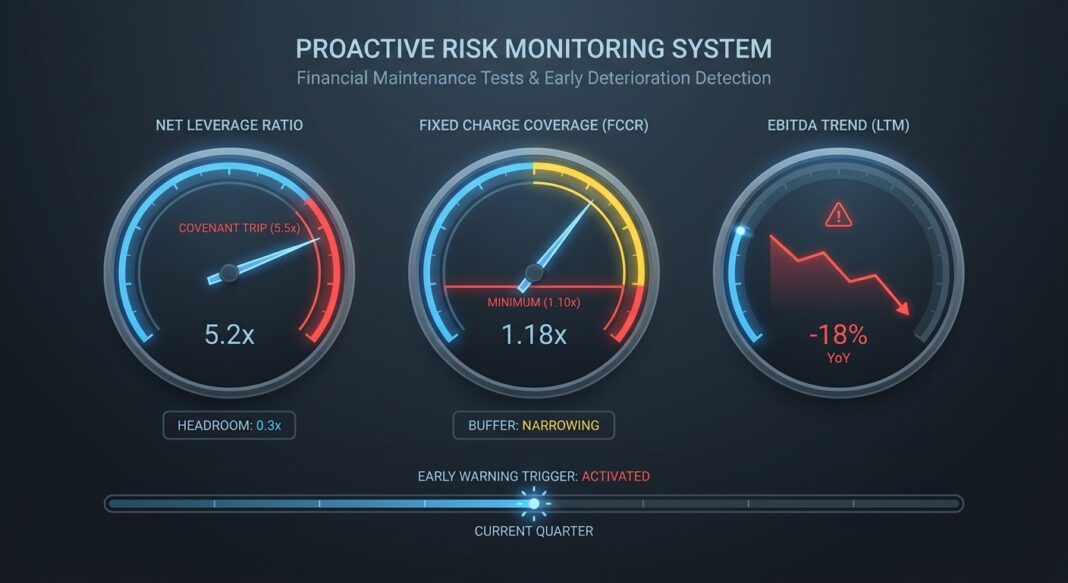
The Underwriting Challenge: When Covenants Fail to Fire
Consider a $10M EBITDA specialty manufacturer carrying 4.5x net leverage on a five-year senior secured term loan. Twelve months post-close, EBITDA has eroded to $7.2M, a 28% decline, driven by margin compression and a lost customer contract. The lender’s loan-to-value has quietly blown through acceptable thresholds, yet no covenant has tripped. No waiver request has arrived. No default notice has been issued. The problem? The credit agreement contained only a springing covenant tied to revolving credit utilization, and the borrower simply stopped drawing on the revolver. This is not a hypothetical edge case. It is the defining failure mode of the post-2015 covenant-lite wave, and it is precisely why rigorous covenant design and active monitoring are among the most consequential skills in direct lending underwriting.
Institutional lenders increasingly recognize that covenant architecture is not boilerplate; it is a primary risk management instrument. According to credit analysis frameworks documented by the CFA Institute, the four traditional pillars of credit analysis (capacity, collateral, covenants, and character) work as a system. Covenants are the early-warning layer that protects collateral recovery when capacity deteriorates.
The Analytical Framework: Maintenance vs. Incurrence Covenants
Not all covenants are created equal. Understanding the structural difference between maintenance and incurrence tests is the foundation of covenant underwriting.
- Maintenance covenants are tested on a periodic basis, typically quarterly, regardless of borrower action. They require the borrower to affirmatively comply with financial ratio thresholds at every measurement date. A breach constitutes an event of default (or at minimum a cure period trigger), giving the lender immediate leverage to accelerate, negotiate, or restructure.
- Incurrence covenants are only tested when the borrower takes a specific action: issuing additional debt, paying a dividend, or making an acquisition. A borrower in slow-motion distress can violate no incurrence covenant while bleeding cash for quarters on end, so long as they remain passive.
For middle market and direct lending transactions, best practice from experienced institutional lenders is to require at least two maintenance covenants: a maximum total leverage ratio and a minimum fixed charge coverage ratio (FCCR). For asset-intensive borrowers or those with significant real estate collateral, a minimum asset coverage ratio may be added as a third maintenance test. As the Overbond Academy notes in its credit analysis framework, coverage ratios measure an issuer’s ability to generate cash flows sufficient to fund its interest payments, a ratio that becomes questionable when it migrates below 1.5x.
Example: Structuring Covenants for a $10M EBITDA Manufacturer
Assume the following entry-point financials for a specialty manufacturing borrower at close:
- LTM Adjusted EBITDA: $10.0M
- Total Debt: $45.0M (4.5x net leverage)
- Annual Interest Expense: $3.6M (8% on drawn balance)
- Capital Expenditures: $1.2M
- Cash Taxes: $0.8M
From these inputs, the underwriter calculates the following baseline covenant levels:
- Total Net Leverage Ratio: 4.5x, covenant set at 5.5x (100bps of headroom above entry, stepping down 0.25x per year)
- Fixed Charge Coverage Ratio (FCCR): EBITDA – CapEx – Cash Taxes ÷ Debt Service = ($10.0M – $1.2M – $0.8M) ÷ $3.6M = 2.22x: covenant set at 1.10x minimum
The step-down schedule in the leverage covenant is critical. Setting a flat ceiling at 5.5x for five years provides no monitoring discipline as the loan amortizes and the business presumably deleverages. A properly constructed step-down forces the borrower to actively reduce leverage in line with original credit thesis assumptions.
Stress Testing the Covenant Structure
Once covenants are set, the underwriter must reverse-engineer the break point, asking: at what level of EBITDA decline does each covenant trip? This is not a forward projection exercise. It is a downside discipline exercise.
Using the manufacturer example above, the leverage covenant trips when EBITDA falls to $8.18M (45.0M ÷ 5.5x), representing an 18.2% decline from LTM. The FCCR covenant trips at an EBITDA of $5.56M (1.10x × $3.6M + $1.2M + $0.8M), representing a 44.4% decline, a threshold that would signal severe distress long before the ratio fires.
This gap between covenant trip levels reveals a structural vulnerability: the leverage covenant acts as the primary early-warning mechanism, while the FCCR is effectively a last-resort signal. Experienced lenders address this by setting the FCCR minimum no lower than 1.10x–1.15x at close, which narrows the coverage buffer to a level that trips at approximately a 25–30% EBITDA decline rather than 44%.
Scenario analysis should cover at minimum three cases: (1) base case aligned with sponsor model, (2) a volume/revenue shock of 15–20%, and (3) a margin compression scenario reflecting input cost inflation or customer concentration risk. The Moody’s Analytics credit portfolio modeling framework underscores that default risk can increase quickly and in correlation with macroeconomic conditions, cyclical sensitivity must be stress-tested explicitly, not assumed away.
Industry Standards: What Institutional Lenders Require
Seasoned direct lenders and institutional credit committees apply a consistent set of structural standards when evaluating covenant packages. Key benchmarks from rating agency and credit research frameworks include:
📊 Data Box: Credit Performance Reference Points
- Recovery proceeds on defaulted corporate loans in developed markets are typically received 12–18 months post-default, with recovery rates varying materially by debt seniority and jurisdiction, per ARC Ratings CLO Criteria.
- Senior secured debt in creditor-friendly jurisdictions (e.g., the U.S.) commands materially higher assumed recovery rates than unsecured or subordinated instruments, per ARC Ratings baseline recovery assumptions.
- A company’s ability to meet interest obligations becomes questionable when EBITDA-to-Interest coverage migrates below 1.5x, per Overbond’s credit analysis framework.
- Credit spread curves tend to steepen and widen materially during periods of weak economic activity, increasing refinancing risk and reducing covenant cure optionality for stressed borrowers, per CFA Institute credit analysis models.
- Granular, well-diversified loan portfolios receive favorable treatment in rating agency analysis, with concentrated positions above 25% of portfolio balance subject to additional scrutiny, per Scope Ratings Asset Portfolio Methodology.
Common Red Flags in Covenant Packages
- EBITDA addback creep: Covenant definitions that permit unlimited or loosely defined addbacks inflate the reported EBITDA base, mechanically widening the headroom between current performance and the trip point.
- Equity cure rights without restrictions: Uncapped or frequently exercisable equity cure provisions allow sponsors to inject capital to cure a breach without addressing underlying operational deterioration, masking distress for multiple quarters.
- Builder baskets tied to cumulative EBITDA: Permitting restricted payments or additional debt based on a cumulative earnings formula can allow significant value leakage before any covenant fires.
- Springing-only covenants: As illustrated in the opening scenario, covenants that only spring into effect upon revolver utilization above a set threshold can be neutralized by a borrower who simply does not draw, eliminating the lender’s primary monitoring tool.
Underwriting Checklist: Covenant Design and Monitoring Diligence
- Define the EBITDA base precisely. Negotiate a definition that limits run-rate addbacks to documented, non-recurring items, with a cap (e.g., no more than 15–20% of reported EBITDA) and a sunset period.
- Calculate covenant headroom in EBITDA decline terms, not ratio terms. Express the trip point as a percentage decline from LTM so the credit committee can evaluate it against historical earnings volatility in the industry.
- Build a step-down schedule into the leverage covenant that reflects the original deleveraging path. Validate the step-down against sponsor projections, if the borrower cannot hit the step-down under base case assumptions, the covenant is structurally defective.
- Require quarterly compliance certificates with supporting EBITDA calculations, signed by a financial officer. Do not accept annual-only reporting for term loan facilities.
- Establish a monitoring trigger below the covenant level: typically 85–90% of the covenant threshold; that activates enhanced lender reporting rights, management calls, or an independent consultant review before a formal breach occurs.
- Review the definition of Consolidated EBITDA, Permitted Debt, and Restricted Payments side-by-side. These three definitions interact to determine how much financial flexibility the borrower retains post-close.
- Stress test collateral recovery under the downside scenario. If the covenant trips and enforcement is required, what is the realizable value of pledged assets within a 12–18 month recovery window? Map this to the loan balance at trip, not at close.
Key Takeaways
- Covenant architecture is a risk management instrument, not legal boilerplate. The difference between a maintenance covenant and an incurrence covenant can be the difference between early intervention and principal loss.
- Express covenant headroom in EBITDA decline percentage, not ratio points. A 1.0x cushion on a 4.5x leverage covenant means something very different at a $10M EBITDA business than at a $100M EBITDA business, normalize to operational context.
- Stress test the EBITDA definition, not just the ratio. Aggressive addbacks inflate the denominator, creating phantom headroom. Underwriting the definition is as important as underwriting the threshold.
- Active monitoring requires pre-breach triggers. Waiting for a formal covenant breach to engage the borrower is reactive risk management. Monitoring triggers at 85–90% of the covenant floor allow proactive lender engagement while cure options remain broader.
- Collateral recovery timing matters as much as recovery rate. A 70% recovery rate realized over 36 months produces a materially worse IRR outcome than the same rate realized in 12 months, model recovery timing explicitly under the downside scenario.


