
Where You Sit Determines What You Get
In private credit, position is everything. Before a single dollar of interest is negotiated or a spread is quoted, the most consequential decision has already been made: where in the capital stack will this loan sit? That single structural choice determines repayment priority, loss exposure, yield expectations, and, in a distressed scenario, whether a lender recovers anything at all.
The capital stack is the ordered hierarchy of claims on a company’s assets and cash flows. Every business that uses outside financing has one, whether it involves a single bank line or a complex layering of senior debt, mezzanine tranches, and preferred equity. Understanding this hierarchy is the foundational literacy required for evaluating any private credit opportunity, as an investor deploying capital or as an operator seeking it.
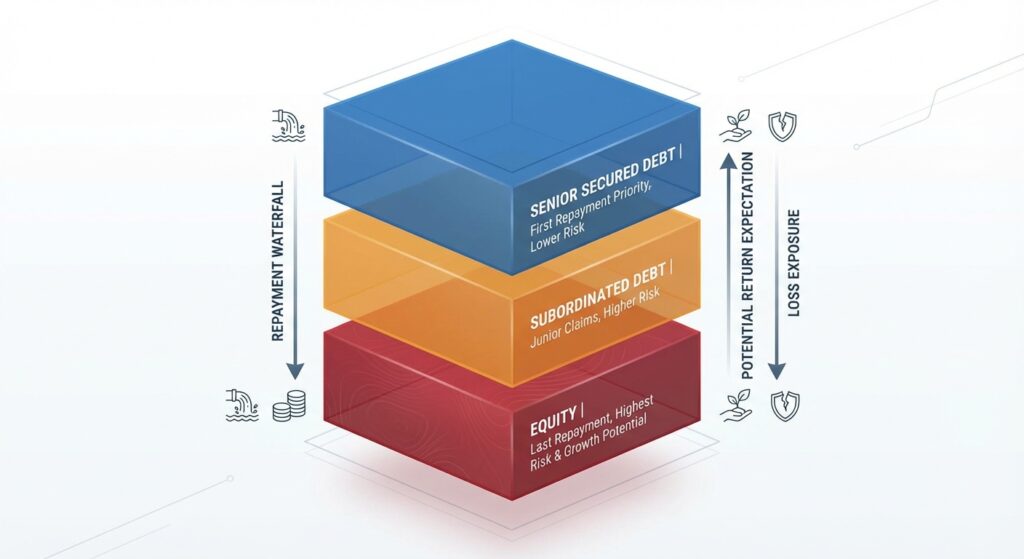
The Three Layers: How the Stack Actually Works
According to Corporate Finance Institute, the capital stack is typically divided into three main layers, each carrying a distinct risk-return profile:
- Senior Secured Debt: The lowest-risk layer. Senior lenders have a first-priority lien on the borrower’s assets and are repaid first in liquidation. Because of this protection, they accept lower yields, typically floating-rate spreads of 500–700 basis points over SOFR in the current direct lending market.
- Subordinated (Junior) Debt: This layer sits beneath senior debt in the repayment waterfall. In a default, subordinated lenders only recover what remains after senior creditors are made whole. To compensate for that subordination risk, yields are meaningfully higher: often 800–1,200+ basis points over benchmark rates, or structured with payment-in-kind (PIK) components.
- Equity: Owners sit at the bottom of the stack. They absorb the first losses and are paid last, but they also capture unlimited upside if the business performs. Equity is the most expensive form of capital precisely because it carries the most risk.
The critical insight is this: risk and return move in opposite directions as you descend the stack. Senior lenders sleep soundly but earn less. Equity investors earn the most, when things go well, but stand to lose everything if they don’t.
A Concrete Example: The $20M Acquisition
Consider a private equity sponsor acquiring a middle-market manufacturing company for $20 million. Here is how a typical capital stack might be structured:
- Senior Secured Term Loan, $10M (50% of deal value): Provided by a direct lender at SOFR + 575 bps. First lien on all assets. If the company is liquidated at even $10M, this lender is fully repaid.
- Mezzanine / Subordinated Note, $4M (20% of deal value): Provided by a second private credit fund at a fixed 13% all-in yield. Only recovers after the $10M senior claim is satisfied. Requires $14M in liquidation proceeds to be made whole.
- Sponsor Equity, $6M (30% of deal value): The PE firm’s own capital. Bears the first $6M of any value loss. But if the company sells for $28M in five years, the equity captures 100% of that $8M gain above the debt.
The equity cushion: that $6M of sponsor capital sitting below the debt, is what protects the senior lender. Even if the business declines in value by 30%, the senior lender is still whole. This is why loan-to-value (LTV) ratios and equity contribution percentages are among the first metrics private credit underwriters scrutinize.
Current Market Relevance: What the Data Shows in 2026
The capital stack framework is not just academic; it is actively being repriced in today’s market. As of early 2026, private credit is navigating what Atlas Peak Research (March 2026) describes as a “liquidity, valuation-credibility, and underwriting-discipline repricing”, a stress that is revealing exactly why stack position matters so much when conditions deteriorate.
Several data points frame the current environment:
- With SOFR at approximately 4.3%, senior direct lending all-in yields of 10–12%+ are achievable without reaching down the credit risk curve, according to Capital Founders OS (March 2026).
- Private credit default rates have been running at approximately 1.45%, compared to 3.37% for broadly syndicated loans: a spread that reflects the structural protections (covenants, equity cushions, senior positioning) that direct lenders embed in their deals, per Cambridge Associates data cited by Capital Founders OS.
- Global private credit AUM is estimated between $1.34 trillion (Fed, Q2 2024 framing) and $2.5+ trillion (BIS AUM statistics), with the variation itself reflecting how differently “assets under management” is defined across vehicles, per Atlas Peak Research.
- PitchBook tracks the asset class growing from $557 billion AUM in 2014 to more than $2 trillion in 2023, with the private debt market projected to reach approximately $3 trillion by 2028 per Mayer Brown (March 2025).
- Family offices doubled their private credit holdings from 2% to 4% of total portfolio in a single year, per the UBS Global Family Office Report 2025 cited by Capital Founders OS.
Critically, the March 2026 liquidity events, including redemption gates at several large semi-liquid private credit vehicles, were concentrated in structure risk, not credit losses. The underlying loans, largely senior secured, continued performing. Stack position held. The stress was in the mismatch between illiquid loan assets and liquid-seeming fund wrappers, a separate but related lesson about vehicle structure.
Decision Framework: Investors and Operators
For Investors Evaluating Private Credit Opportunities
Before evaluating yield, investors consider stack position as the primary filter:
- What is my lien position? First-lien senior secured is structurally different from second-lien or unsecured, even in the same company. Never conflate them.
- How large is the equity cushion beneath me? A 30% equity contribution from the sponsor means the asset must lose nearly a third of its value before your principal is threatened. A 10% cushion provides far less buffer.
- What is the loan-to-value ratio at origination? Lower LTV at senior levels provides a larger margin of safety. Underwriting discipline here is the most durable form of protection.
- Am I being compensated for my actual position? A second-lien loan priced like a first-lien loan is a structural mispricing. Stack-adjusted yield is the relevant comparison, not headline spread.
For Operators Seeking Capital
Business owners approaching the capital markets benefit from mapping their financing needs to the stack before engaging lenders:
- Senior debt is the cheapest external capital, but it comes with collateral requirements and covenant constraints. Operators with hard assets (equipment, real estate, receivables) can anchor a senior facility and minimize dilution.
- Mezzanine debt fills the gap between what senior lenders will provide and what the business needs, at a higher cost. Operators evaluate mezzanine when equity dilution would be more expensive than a 12–14% subordinated note.
- Equity should be the last resort for non-dilutive operators: raised only when debt capacity is exhausted or when the business requires a strategic partner, not just capital.
Key Takeaways
- Stack position is the primary risk variable in private credit: yield must be evaluated relative to where in the repayment waterfall a lender sits, not in isolation.
- Equity cushion is a senior lender’s first line of defense. The larger the sponsor’s equity contribution, the greater the protection for debt holders above it.
- Lower LTV at origination is the most durable underwriting protection: it determines how far asset values can fall before a lender faces principal loss.
- The 2026 market stress is a structure story, not a credit story. Senior secured loans are performing; the pain is in vehicle design mismatches, reinforcing why loan-level stack position remains the anchor of sound private credit underwriting.
- For operators, mapping the capital stack before engaging lenders clarifies which financing layer best serves the business: minimizing dilution, cost, or constraint depending on the company’s priorities and asset profile.


