
Why Your Position in the Stack Is Everything
In private credit, not all lenders are created equal. Two investors can fund the exact same company, in the same transaction, at the same moment, and face completely different risk profiles. The reason comes down to one foundational concept: capital stack position. Where a lender sits in the hierarchy of claims against a borrower’s assets determines who gets paid first, who absorbs losses first, and crucially, how much yield is required to justify the risk.
For investors evaluating private credit opportunities and for business operators structuring their financing, understanding capital stack subordination is not optional. It is the single most important lens through which any credit investment or borrowing decision should be viewed.
The Capital Stack Defined
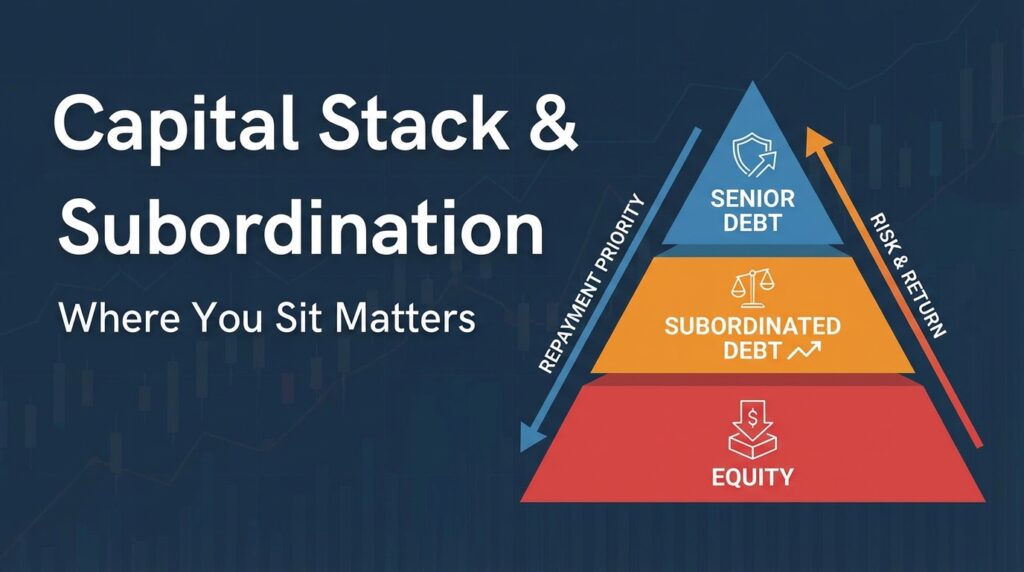
The capital stack is the structured hierarchy of all financing sources used to fund a company’s assets, operations, or a specific transaction. Think of it as a literal stack of claims, ordered from lowest risk at the bottom to highest risk at the top. According to Corporate Finance Institute (Feb 2025), the stack is typically divided into three main layers:
- Senior Debt: First-priority claim on assets, lowest cost of capital, repaid first in any liquidation or restructuring event.
- Subordinated Debt: Ranks below senior debt in repayment priority; compensates lenders with higher interest rates to reflect the elevated risk.
- Equity: Represents ownership; carries the highest risk and is the last to receive proceeds, but captures the upside if the business performs.
Subordination is the legal and contractual mechanism that enforces this hierarchy. A subordinated lender formally agrees (through intercreditor agreements or contractual provisions) that the senior lender’s claims must be fully satisfied before any recovery flows to them. This is not a gentlemen’s agreement; it is binding legal architecture that courts enforce in bankruptcy proceedings.
Within private credit specifically, Umbrex’s Private Credit Industry Primer (Nov 2025) notes that the asset class spans multiple stack positions: senior secured direct lending, unitranche loans, second-lien debt, mezzanine debt, and preferred equity, each occupying a distinct rung with distinct risk-return characteristics.
How It Works: A Concrete Example
Consider a mid-market manufacturing company with $50 million in enterprise value seeking to fund a leveraged buyout. The sponsor structures the following capital stack:
- Senior Secured Loan (First Lien): $20 million, Priced at SOFR + 450 bps (approximately 8.8% all-in with SOFR near 4.3%)
- Second Lien / Mezzanine Debt: $10 million, Priced at 13–15% (cash or PIK)
- Equity (Sponsor): $20 million, No fixed return; captures residual value
Total capital deployed: $50 million. Now stress-test the scenario. The business underperforms and is liquidated at $25 million: half of enterprise value.
- The senior lender is owed $20 million and recovers the full $20 million from the liquidation proceeds. Full recovery.
- The mezzanine lender is owed $10 million but only $5 million remains after the senior claim. They recover 50 cents on the dollar.
- The equity sponsor is owed nothing contractually but invested $20 million. They recover $0. Total loss.
This is subordination in action. The senior lender’s yield of ~8.8% reflects that protection. The mezzanine lender’s 13–15% yield reflects the real possibility of a 50% haircut. Equity investors target 20%+ IRRs because they are last in line, every other dollar of loss is absorbed before their position is impaired.
The equity cushion, in this case the $20 million in sponsor equity, functions as a first-loss buffer for every lender above it. The thicker that buffer, the safer the senior debt. Evaluating the size and quality of this cushion is a core discipline in private credit underwriting.
Current Market Relevance
Understanding stack position has become especially critical as private credit enters a period of structural stress testing. As of March 2026, a confluence of factors is sharpening lender focus on where exactly their capital sits:
- According to Atlas Peak Research (Mar 2026), global private credit assets stand at roughly $1.34 trillion in the U.S. and nearly $2 trillion globally under Fed framing, with the BIS placing AUM statistics above $2.5 trillion, a scale that amplifies the importance of structural discipline at the instrument level.
- The same Atlas Peak report identifies that the sharpest stress in early 2026 is concentrated in semi-liquid vehicles holding illiquid middle-market loans, not in classic senior secured closed-end funds, which broadly match asset duration to capital lockups. Stack position and vehicle structure are increasingly intertwined risks.
- According to Capital Founders OS (Mar 2026), with SOFR near 4.3%, senior direct lending strategies are generating 10–12%+ all-in yields without reaching down the risk curve into subordinated positions, an environment that rewards patience and seniority.
- Capital Founders OS (Mar 2026) also cites Cambridge Associates data showing private credit default rates running at 1.45% versus 3.37% for broadly syndicated loans, a differential that partly reflects the tighter covenants and senior-secured positioning prevalent in direct lending.
- Technology and software exposure, noted by Capital Founders OS (Mar 2026) as representing 19–25% of private credit portfolios: is now a sector-level concentration risk that interacts directly with stack position. A second-lien loan to a stressed software business in 2026 carries materially different risk than it did in 2021.
| Position | Typical Yield (2026) | Loss Absorption | Recovery Priority |
|---|---|---|---|
| Senior Secured (First Lien) | SOFR + 400–550 bps (~8–10%) | Last to absorb losses | First |
| Unitranche | SOFR + 500–650 bps (~9–11%) | Blended; depends on AAOC | First (single facility) |
| Second Lien / Mezzanine | 13–16% (cash/PIK blend) | Absorbs before equity | Second |
| Preferred Equity | 15–20% (preferred return) | Absorbs before common | Third |
| Common Equity | 20%+ IRR target | First-loss position | Last |
Sources: corporatefinanceinstitute.com; capitalfounders.io; umbrex.com. Yield ranges are illustrative of current market conditions and not a guarantee of future results.
Decision Framework
For Investors Evaluating Private Credit
Before committing capital, investors consider the following stack-specific questions:
- What is the loan-to-value (LTV) at my attachment point? A first-lien lender at 40% LTV has a very different risk profile than one at 65% LTV, even in the same stack position.
- How thick is the equity cushion below me? Sponsor equity of 30%+ provides meaningful first-loss protection. Thin equity tranches (10–15%) erode quickly in a stress scenario.
- What covenants govern my position? Senior secured private credit typically carries maintenance covenants, financial tests the borrower must pass quarterly, that provide early warning and intervention rights unavailable in public markets.
- Does the yield compensate for the subordination risk? Investors who accept second-lien or mezzanine positions for yields only marginally above senior debt are not being adequately compensated for the incremental loss exposure.
- Does the vehicle structure match the asset? As Atlas Peak Research highlights, illiquid middle-market loans held in semi-liquid vehicles create a secondary risk layer that is entirely separate from the underlying credit quality.
For Business Operators Structuring Capital
Operators and CFOs evaluating how to build their capital stack consider a parallel set of questions:
- How much senior debt capacity does the business support? Senior lenders typically size loans at 3–5x EBITDA for stable businesses. Exceeding this threshold pushes incremental capital into more expensive subordinated layers.
- Is mezzanine debt worth the cost? Mezzanine at 14–16% may be preferable to issuing equity at a dilutive valuation, but only if the business generates sufficient cash flow to service the obligation, including PIK accrual.
- What flexibility do you need? Senior secured private credit, as noted by Clockwork (Nov 2025), offers bespoke, negotiated terms that public markets cannot provide: including flexible amortization schedules, covenant headroom, and faster execution.
Key Takeaways
- Position determines outcome in a stress scenario. In any liquidation or restructuring, capital stack seniority, not yield, is the primary driver of recovery. Senior secured lenders historically recover 70–90 cents on the dollar; mezzanine lenders often recover far less.
- Higher yield always signals higher subordination risk. When a private credit strategy offers materially higher yields than senior direct lending, the yield premium reflects a weaker position in the stack, not superior manager skill alone.
- The equity cushion is a lender’s first line of defense. Evaluating the size, quality, and dilution triggers of the equity tranche below any debt position is essential underwriting discipline.
- Current market conditions reward seniority. With senior direct lending generating 10–12% all-in yields at SOFR + 400–550 bps, investors in early 2026 can access attractive risk-adjusted returns without moving down the stack.
- Operators should map cost against flexibility. Moving from senior debt to mezzanine or preferred equity adds significant interest cost, but may preserve ownership and operational flexibility in ways that equity issuance does not.


