
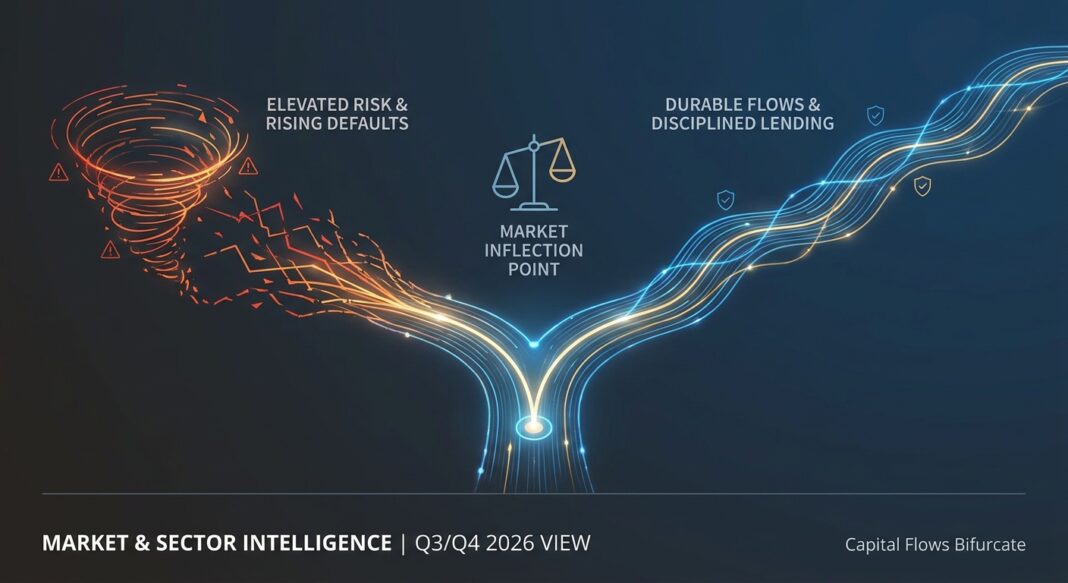
Private Credit at an Inflection Point: Spreads Stabilize, Defaults Rise, and Capital Bifurcates
Bond Capital | Market & Sector Intelligence — October 23, 2026
Market Headline: A Bifurcated Credit Cycle Takes Hold
The U.S. private credit market enters Q4 2026 in a state of structural tension. On the surface, a $1.3-trillion asset class continues to raise capital and deploy at competitive yields — but beneath that headline, a profound bifurcation is reshaping where and to whom credit flows. Middle-market unitranche spreads have stabilized following a 25-basis-point widening in March 2026, with new-issue coupons ranging from SOFR+500 to SOFR+575 bps, approximately 25–50 bps above year-end 2025 levels. With overnight SOFR holding near 3.88%, all-in floating-rate yields for core middle-market borrowers are running in the high single digits — an environment that remains structurally attractive for disciplined lenders but increasingly punishing for operationally challenged borrowers.
The macro signal most critical for operators and investors alike is the divergence between a stabilizing rate environment and a rising default cycle. The Fed’s target range sits at 3.75%–4.00%, and forward curves suggest only modest cuts through 2028. Against this backdrop, Fitch’s private credit default rate climbed to a record 6.3% in August 2026, driven disproportionately by lower-middle-market borrowers with sub-$25 million EBITDA and by portfolios concentrated in software — sectors now facing the dual headwinds of AI-driven disruption and aggressive 2021–2022 vintage leverage. Simultaneously, the Fed’s July 2026 SLOOS reported that bank C&I lending standards for large and mid-market firms normalized to 0.0% net tightening in Q3, the first neutral reading since 2024. Banks are quietly re-entering the lending market, reclaiming syndicated share from private credit — particularly in large-cap LBOs — and reshaping the competitive dynamics that defined private credit’s expansion over the prior four years.
The operating implication: capital is abundant but selective. North American private credit dry powder exceeds $280 billion, yet its availability is increasingly a function of which fund you are approaching, which sector you operate in, and whether your vintage-era leverage structure can withstand a higher-for-longer rate environment. This is not a broad market dislocation — it is a credit cycle maturing unevenly, punishing the leveraged and illiquid while rewarding businesses with durable cash flows, tangible assets, and conservative debt structures.
Quantitative Market Snapshot
Data Box: Key Credit Market Metrics — October 2026
| Metric | Current Value | Prior Period | Change | Source |
|---|---|---|---|---|
| Overnight SOFR | 3.88% | 4.18% (Oct 2025) | ▼ −30 bps YoY | FRED / NY Fed |
| TM Unitranche Spread (Core MM) | SOFR +500–575 bps | SOFR +475–550 bps (YE 2025) | ▲ +25 bps | VRC Q3 2026 |
| All-In Unitranche Yield (Core MM) | ~9.4%–9.6% (est.) | ~8.9%–9.1% (YE 2025) | ▲ +~43 bps vs YE 2025 | VRC Q3 2026 |
| US High Yield OAS (ICE BofA) | ~327 bps | ~304 bps (Oct 2025) | ▲ +23 bps YoY | FRED / ICE BofA |
| IG Corporate Bond Spread (ICE BofA) | 86 bps | 80 bps (Oct 2025) | ▲ +6 bps YoY | FRED / ICE BofA |
| Private Credit Default Rate (Fitch) | 6.3% (Aug 2026, record high) | 5.7% (Q1 2026) | ▲ +60 bps | Yardeni / Fitch |
| Fed SLOOS: C&I Tightening (Large/Mid Firms) | 0.0% net tightening (Q3 2026) | 8.1% net tightening (Q2 2026) | ▼ Easing to Neutral | FRED / Fed SLOOS |
| Direct Lending LBO Volume (Q3 2026) | ~$10.7B | Higher in Q2 2026 & Q3 2025 | ▼ Declining | Sikich / LCD Q3 2026 |
| Private Credit Dry Powder (N. America) | >$280B | High but increasingly selective | — | CAPX / Industry Data |
| Median Interest Coverage (KBRA Mid-Market) | ~1.6x (Q1 2026) | ~1.5x range (2021–22 cohorts) | ▲ Improving, albeit fragile | Coller / KBRA Q1 2026 |
Note: All-in yield estimate is indicative, calculated using 90-day SOFR (~3.73%) plus midpoint unitranche spread. Core middle-market defined as companies with $50M–$250M enterprise value. Sources: FRED, VRC, Fitch, KBRA, LCD/PitchBook, ICE BofA via FRED.
Rates, Spreads & KPI Context
The spread differential between private credit and public high yield has narrowed materially over the past several years. In 2019, private credit offered approximately 350 bps of premium over comparable public high yield; that premium has compressed to an estimated 150–200 bps today, as capital has crowded into the asset class and borrowers have gained pricing leverage in competitive processes. With the high yield composite OAS sitting at approximately 324 bps and investment-grade spreads at just 86 bps — both well below long-run historical averages — public credit markets are reflecting investor confidence in earnings durability, even as CCC-rated spreads surge toward 1,215 bps, an acute signal of distress at the bottom of the credit quality spectrum.
On leverage and coverage: new-deal leverage multiples for competitive, high-quality transactions are running at 5.0x–6.0x EBITDA, reflecting continued competitive pressure, though below the 6.5x–6.8x peak observed in 2021–2022 vintages. Those earlier vintages — underwritten with lower base rate assumptions, higher PIK usage, and more aggressive EBITDA projections — now report median interest coverage of just 1.7x–1.8x, with some stressed cohorts deteriorating further. A fixed charge coverage ratio (FCCR) below 1.25x is generally the threshold at which lenders begin to flag covenant concerns; the compression of coverage ratios in 2021–2022 book is a primary driver of rising non-accruals and restructuring activity. More recent vintages (2024–2026) benefit from more conservative underwriting and are showing improved debt-service capacity, though competition for quality deals continues to exert upward pressure on leverage multiples.
Sector Analysis: Lender Appetite and Structural Shifts
The most important structural development in private credit sector allocation in 2026 is the rotation out of software and into healthcare and industrials — a shift with direct implications for pricing, documentation standards, and lender concentration risk.
Healthcare: The Dominant Sector — But Under Closer Scrutiny
Healthcare has emerged as the single largest sector for U.S. direct lending, accounting for approximately 22% of all direct lending issuance year-to-date through early 2026, up from 18% in 2025. Lenders are drawn to healthcare’s non-cyclical demand characteristics, predictable cash flows, and the ongoing consolidation of physician platforms, behavioral health networks, and post-acute operators. Octus data shows healthcare spreads holding at approximately SOFR+500 bps in recent quarters — one of the few sectors that did not experience meaningful spread tightening during 2025 — suggesting lenders are maintaining discipline in exchange for the sector’s defensive qualities. However, Morgan Stanley’s 2026 credit team maintains a notable underweight to healthcare in new commitments, citing healthcare’s lead across all sectors in loans placed on non-accrual status over the past year — a tension that reflects the divergence between aggregate capital flows and credit performance within the sector.
Software & Technology: Capital Pull-Back and Spread Widening
Software is the sector under the most acute pressure. Software and technology credits now price 50–100 bps wider than broader market levels, per VRC Q3 2026 data, reflecting lender caution around AI-driven disruption, SaaS revenue model stress, and portfolio concentration risk in BDC books. Software represents approximately 26% of BDC exposure across major platforms, and nearly one-fifth of software debt trades below 90 cents on the dollar, per S&P Market Intelligence. JP Morgan moved to tighten advance rates to non-bank lenders on software collateral earlier in the year, a structural signal that bank counterparties are repricing their own exposure. For borrowers in software sub-segments, the combination of wider new-issue spreads, tighter documentation requirements, and reduced leverage availability represents a genuine structural shift — not a temporary repricing.
Industrials, Manufacturing & Essential Services: Active Competition for Quality Credits
The sectors seeing the most active lender competition in Q4 2026 are manufacturing, distribution, environmental services, and infrastructure-adjacent businesses. S&P Global’s April 2026 cross-industry analysis confirmed that manufacturing and essential-services credits attract active competition even as software credits face pullback. Industrial-focused lenders — who tend to underwrite against tangible assets, contracted revenue, and normalized EBITDA — are actively seeking credits with FCCRs above 1.50x and leverage below 5.0x. This pocket of the market is experiencing pricing close to the tighter end of middle-market ranges, with sponsors able to secure terms comparable to late-2024 conditions. The boomer succession wave in the lower middle market continues to generate deal flow in manufacturing and distribution, where the $5M–$25M EBITDA segment offers spread premiums of over 230 bps above large-cap — a structural advantage for managers with operational scale at the lower end.
Infrastructure & Data Centers: Emerging Long-Duration Theme
Private credit’s role in funding AI-driven infrastructure is expanding rapidly. Morgan Stanley estimates that private credit could supply more than half of the estimated $1.5 trillion needed for global data center buildouts through 2028, with infrastructure lending offering longer duration, asset-backed structures that appeal to insurance company and pension fund LPs seeking liability-matched cash flows. This segment of the market is characterized by lower spreads relative to traditional middle-market direct lending, but with structural protections — real assets, long-term offtake agreements, and regulated revenue streams — that substantially reduce recovery risk in stress scenarios.
Strategic & Operational Implications
For Borrowers & Operators
The single most important action for operators approaching the debt markets in Q4 2026 is to understand that not all private credit funds are equally available. With over $280 billion in dry powder, capital exists — but BDC redemption pressures, maturity wall management, and software portfolio workouts are consuming underwriting bandwidth at a subset of major platforms. A $12.7 billion BDC maturity wall is narrowing refinancing bandwidth for funds managing existing portfolios, making fund selection as critical as transaction structure for performing borrowers.
Operators in manufacturing, distribution, healthcare services, and infrastructure-adjacent sectors with FCCRs comfortably above 1.25x, leverage below 5.0x EBITDA, and stable-to-growing top lines are positioned to access competitive financing — potentially at the tighter end of unitranche ranges. Conversely, businesses with elevated PIK debt, declining EBITDA, or legacy 2021–2022 vintage loan structures face a materially more difficult refinancing environment: downgrade volume has risen 50% year-over-year, and 42% of downgrades are moving borrowers into CCC territory or lower. Proactive balance sheet management — addressing covenant headroom, de-levering ahead of maturity walls, and engaging lenders in constructive amendment discussions — is no longer optional for operators in these cohorts.
For Institutional Investors & Lenders
The stabilization of bank C&I lending standards to 0.0% net tightening in Q3 2026 (down from 8.1% in Q2) signals that banks are re-entering competitive lending, particularly in large-cap and broadly syndicated markets. This has contributed to a decline in direct lending LBO volume and is compressing the spread premium private credit commands over public alternatives. Institutional investors must reassess whether the 150–200 bps illiquidity premium over comparable high yield — down from ~350 bps in 2019 — adequately compensates for concentration risk, valuation opacity, and the liquidity mismatches now surfacing in semi-liquid BDC structures. The SEC has opened formal enforcement probes into major private credit managers on valuation and disclosure compliance, adding a regulatory overlay that will increase operational costs and potentially reduce net returns at fund level.
For lenders deploying new capital, the current environment favors managers with: (1) sector specialization in non-software verticals with active deal flow; (2) lower-middle-market origination capability, where spread premiums are structurally wider and competition remains thinner; (3) conservative underwriting anchored to FCCRs above 1.50x and leverage at or below 5.0x; and (4) the legal and operational infrastructure to conduct meaningful stress analysis before capital commitment — a differentiator explicitly cited by Lord Abbett’s 2026 midyear outlook as a source of durable alpha.
Forward-Looking View: Next 3–6 Months
The credit cycle is in a mid-to-late expansion phase with idiosyncratic stress concentrated in specific sectors and vintages rather than systemic deterioration. Several dynamics will shape conditions through Q1 2027:
- Default trajectory: Fitch’s private credit default rate has remained at or above 6.0% every month since April 2026. Issuers with sub-$25M EBITDA are defaulting at a 12.3% rate — roughly triple the rate of larger peers. With a 2027–2028 maturity wall approaching, distressed exchanges, liability management exercises, and restructurings will remain elevated, particularly in software and lower-middle-market cohorts. Normalization below 5% is unlikely before mid-2027 absent a significant improvement in EBITDA growth across leveraged borrowers.
- Rate environment: The federal funds target range of 3.75%–4.00% and SOFR near 3.88% are expected to be relatively stable, with market projections implying an average base rate of approximately 3.5% through 2028 — modestly higher than prior expectations. This sustains attractive all-in yields for lenders but keeps absolute debt-service costs elevated for floating-rate borrowers.
- BSL vs. private credit: The broadly syndicated loan market rebounded sharply in September 2026, with M&A-related institutional loan issuance reaching $39.9 billion in Q3, and September alone contributing $30.6 billion — the highest monthly total since January 2022. The syndicated market is winning back share in large-cap buyouts and refinancings, a trend that will continue to pressure private credit deployment volumes at the upper end of the market.
- Regulatory pressure: The SEC’s heightened focus on private credit valuations, fair value practices, and disclosure compliance will increase operational burden for fund managers, potentially widen NAV dispersion across reporting periods, and incentivize consolidation toward scaled platforms with institutional-grade risk frameworks.
- Fundraising: Despite BDC redemption pressures and elevated defaults, private credit raised approximately $190 billion in H1 2026. Institutional demand from pension funds and insurers — which hold approximately 40% of private credit funds as long-term, liquidity-premium investments — remains structurally intact. The fundraising environment is bifurcated: top-DPI performers with clear track records are raising quickly; newer or software-concentrated managers face significantly longer timelines.
Key Market Insights
- ● Spreads have stabilized, not compressed. Core middle-market unitranche spreads (SOFR+500–575 bps) are holding approximately 25–50 bps above year-end 2025 levels following March 2026 widening. Spread compression from Q4 2025 lows has paused, supported by the moderation of new-issue supply and selective lender appetite. Operators refinancing in this environment should expect costs ~40–50 bps higher than 2025 close levels on an all-in basis.
- ● The default cycle is real and concentrated. Fitch’s record 6.3% private credit default rate is not a market-wide phenomenon — it is concentrated in sub-$25M EBITDA borrowers, 2021–2022 vintage over-levered structures, and software/SaaS portfolios facing AI disruption. Investors and operators in these cohorts face material refinancing and restructuring risk ahead of the 2027–2028 maturity wall.
- ● Bank re-entry is reshaping the competitive landscape. The Fed’s July 2026 SLOOS shows C&I lending standards for large and mid-market firms at 0.0% net tightening — the first neutral reading since 2024. Banks are reclaiming market share in large-cap syndicated lending, compressing the addressable market for private credit at the upper end and further concentrating private lender value-add in the core and lower middle market.
- ● Healthcare and industrials are the active competition zones; software is a yield premium with elevated risk. Healthcare accounts for ~22% of direct lending issuance and industrials/essential services are attracting multi-lender competition for quality credits. Software credits price 50–100 bps wider than market — offering a yield pickup that must be weighed against above-average default risk, AI disruption exposure, and tightening bank advance rates on software collateral.
- ● Underwriting discipline on FCCRs and leverage is the primary differentiator. The divergence in portfolio performance between 2021–2022 vintages (median FCCR ~1.7–1.8x, leverage ~6.5–6.8x) and more recent originations (leverage ~5.0–6.0x with improving coverage) underscores that the lenders best positioned for the next 12–18 months are those who maintained discipline on fixed charge coverage thresholds above 1.50x and resisted the late-cycle pressure to extend aggressive EBITDA add-backs and PIK structures.


