
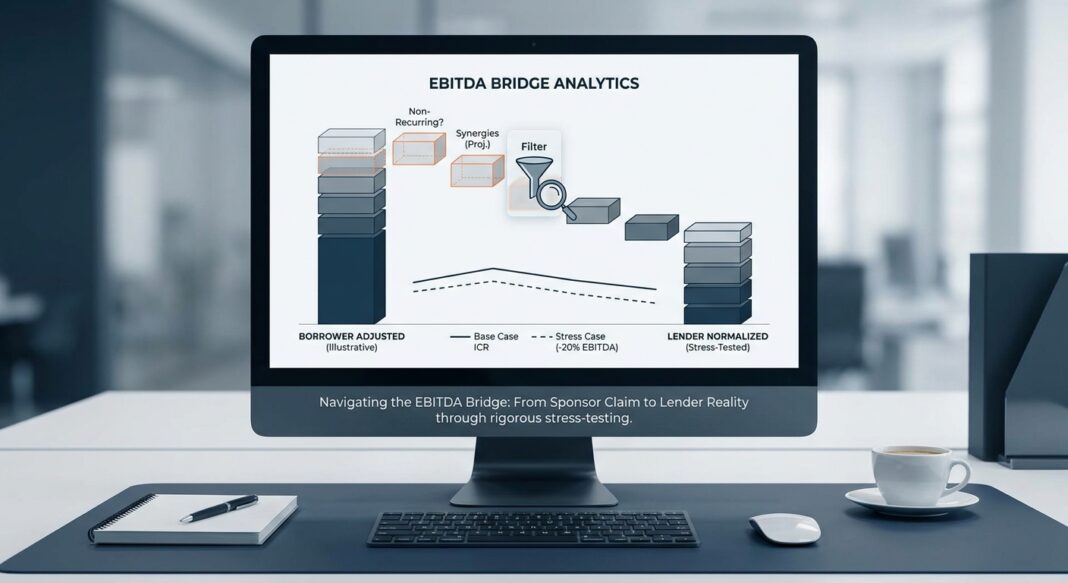
The Underwriting Challenge: One Number Does All the Work
Every structural decision in a credit agreement (the leverage covenant, the interest coverage test, the debt incurrence basket, the maximum permitted indebtedness) runs through a single defined term: EBITDA. That dependency makes the quality of the EBITDA calculation the single most consequential judgment call in middle-market underwriting.
The problem is structural. Borrowers and sponsors present Adjusted EBITDA, a management-prepared figure that adds back items they characterize as non-recurring, non-cash, or owner-specific. Lenders then use that figure, or some version of it, to set covenant levels and approve credit. When the adjustments are defensible, this is appropriate. When they are not, the lender has built an entire credit structure on a foundation of inflated earnings.
The Financial Stability Board flagged exactly this risk in its May 2026 report on private credit vulnerabilities, noting that with EBITDA adjustments stripped out, true leverage in private credit could be materially higher than covenant-defined ratios suggest. Understanding how to interrogate, haircut, and stress-test every line in an EBITDA bridge is not a technical formality; it is the core discipline of credit underwriting.
The Analytical Framework: A Three-Layer EBITDA Taxonomy
Experienced credit analysts apply a structured taxonomy before evaluating any individual adjustment. Quality of Earnings practice organizes the EBITDA bridge into three structural layers, and the distinction between them determines how much scrutiny each line item deserves.
Layer 1: Definitional Adjustments
These are the standard add-backs to arrive at EBITDA from net income: interest expense, income taxes, depreciation, and amortization. They are non-controversial by definition. No lender disputes them, and no analysis should spend material time here beyond confirming the arithmetic ties to audited financials.
Layer 2: Quality-of-Earnings Adjustments (One-Time Items)
This layer covers items the borrower characterizes as non-recurring: settled litigation costs, M&A advisory fees, restructuring charges, facility closure costs, and similar items. These get tested on a single question: will this item genuinely not recur? That test is where most diligence effort concentrates.
The evidentiary standard matters. A defensible add-back requires source documentation backing the number, a narrative explaining why the item is genuinely non-recurring or owner-specific, a benchmark supporting any market-rate claim, and categorization consistent with how comparable transactions treat the same type of item.
Layer 3: Normalization Adjustments (Recurring Mispriced Items)
These cover recurring items that are incorrectly priced on the books: owner compensation set above market rate, related-party rent that doesn’t reflect an arm’s-length lease, family members on payroll without substantive roles, or marketing spend slashed pre-sale to inflate near-term EBITDA. These adjustments require independent benchmarking, not borrower representation.
Key principle: Adjusted EBITDA is only useful when it predicts repayment capacity. If an adjustment improves the story but does not improve recurring cash flow, it should not drive approval.
Walking the Bridge: A $10M EBITDA Manufacturing Company
Consider a sponsor-backed manufacturing business with reported EBITDA of $8.5M and an adjusted EBITDA claim of $10.95M, a 29% premium to reported earnings. The sponsor is seeking senior debt at 5.0x adjusted EBITDA, implying $54.75M in debt. The lender’s job is to determine whether the $10.95M is real.
| Line Item | Sponsor Claim | Lender View | Rationale |
|---|---|---|---|
| Reported EBITDA | $8,500,000 | $8,500,000 | Ties to audited P&L |
| Owner comp excess | +$385,000 | +$300,000 | Haircut: replacement CEO at $325K per market data, not $240K |
| Related-party rent | +$120,000 | +$120,000 | Accepted: documented CoStar comparable |
| One-time legal settlement | +$165,000 | +$165,000 | Accepted: settled with prejudice, documented |
| Projected synergies (cost savings) | +$750,000 | +$250,000 | Haircut 67%: unrealized, no operating history behind claim |
| Non-recurring revenue (one-time customer) | – | -$175,000 | Lender-initiated: large one-time order inflating TTM revenue |
| Restructuring (office closure) | +$85,000 | +$85,000 | Accepted: documented severance and lease termination |
| Discretionary owner perks | +$95,000 | +$95,000 | Accepted: club membership, vehicle, undocumented spouse salary |
| Lender-Adjusted EBITDA | $10,950,000 | $9,340,000 | 14.7% below sponsor claim |
The result: the sponsor underwrote to $10.95M; the lender underwrites to $9.34M. At 5.0x, the sponsor’s leverage calculation yields $54.75M in debt capacity. The lender’s figure yields $46.7M, a gap of over $8M in allowable debt. That difference determines whether the capital structure is serviceable under a mild stress scenario or impaired from day one.
Stress-Testing the Lender-Adjusted Figure
After establishing the lender-adjusted EBITDA, the next step is cash flow stress testing. Apply a 20%–25% EBITDA haircut to simulate a demand contraction or margin compression scenario, then recalculate coverage ratios:
- Base Case: $9.34M EBITDA ÷ ~$4.5M cash interest = 2.08x Interest Coverage Ratio (ICR)
- Stress Case (–20% EBITDA): $7.47M EBITDA ÷ $4.5M = 1.66x ICR, approaching covenant threshold
- Severe Stress (–30% EBITDA): $6.54M EBITDA ÷ $4.5M = 1.45x ICR, covenant breach likely
Lenders should also examine the Debt Service Coverage Ratio (DSCR), calculated as (EBITDA – CapEx – Taxes – Working Capital Change) ÷ Total Debt Service. A DSCR below 1.10x in a stress scenario is a material warning signal in most institutional underwriting standards.
Industry Standards: What the Data Shows About Add-Back Risk
The market trend in add-back practices is well-documented and moves in the direction of greater lender risk. Practitioners should be grounded in current benchmarks before evaluating any specific transaction.
- Add-back caps: The most common aggregate add-back cap in private credit documentation is 20%–24.9% of EBITDA; only 4% of lenders allowed uncapped add-backs as of 2024 (Proskauer Private Credit Survey, via askcontinua.com).
- True leverage gap: The Financial Stability Board (May 2026) estimated that private credit borrowers carry 5–6x covenant leverage but approximately 7x true leverage once EBITDA adjustments are stripped out.
- Covenant-lite expansion: Covenant-lite structures in direct lending rose to 21% of deals in 2026, up from 4% in 2023, with 91% of those deals concentrated in borrowers above $50M EBITDA (Proskauer, via ABF Journal, June 2026).
- Private credit default range: Moody’s estimated the 2025 private credit default rate between 1.6% and 4.7%, depending on whether distressed exchanges are included. Distressed restructurings accounted for approximately 65% of all corporate defaults in 2025 (Moody’s Ratings, 2026).
- Senior secured recovery: Middle market senior secured first-lien loans averaged approximately 69% recovery, modestly above the ~65% average for broadly syndicated senior secured loans (arxiv.org, 2026 academic review of private credit empirical data). Standard & Poor’s ultimate recovery data shows mezzanine recovery of only 20%–40% versus 60%–75% for first-lien senior.
- CDLI long-run loss rate: The Cliffwater Direct Lending Index reports a 20-year average annual credit loss rate of 1.01% across approximately 21,000 loans totaling $549 billion, though the senior-only CDLI-S isolates an annualized loss rate of just 0.29% from 2010–2025 (Cliffwater).
- Leverage creep: Median net debt among private credit borrowers rose 9.7% year-over-year in Q1 2026, pushing median net leverage to 5.3x (MSCI, via askcontinua.com, October 2026).
Red Flags in Borrower-Submitted EBITDA
Experienced lenders have learned to identify patterns of aggressive presentation. The most persistent red flags include:
- Add-backs exceeding 25% of reported EBITDA. When aggregate adjustments cross this threshold (particularly if dominated by run-rate synergies or projected cost savings) require independent validation and apply materially tighter caps.
- Projected synergies with no operating history. Synergy and cost-savings add-backs are uncertain in both magnitude and timing. Underwriting entities should subject all such adjustments to credible time horizons and apply significant haircuts for unrealized savings.
- Growth spend characterized as non-recurring. Borrowers sometimes add back marketing or hiring costs as "strategic investments." If the spend is needed to sustain revenue or win customers, it should not be removed from EBITDA.
- Covenant EBITDA materially higher than GAAP EBITDA. Covenant EBITDA in practice can run 20%–40% higher than reported EBITDA due to permitted add-backs. This creates artificial headroom that does not reflect actual cash generation.
- One-time items recurring across multiple periods. Scan three years of financials. If "one-time" items appear in each year, they are not one-time. The cleanest credit analysis presents both borrower-adjusted EBITDA and lender-adjusted EBITDA with a clear bridge between them.
Underwriting Checklist: EBITDA Normalization Diligence
The following checklist reflects institutional-grade diligence requirements for evaluating an adjusted EBITDA claim in a direct lending or private credit underwriting context.
Documentation Requirements
- ☐ Audited financial statements for trailing three fiscal years, tie reported EBITDA to these before engaging any add-back discussion
- ☐ Full general ledger detail and trial balance for the trailing twelve months
- ☐ Payroll registers with owner and related-party compensation detail
- ☐ Copies of all related-party contracts (leases, management fees, consulting agreements)
- ☐ Third-party support for all market-rate benchmarks (CoStar, compensation surveys, comparable lease data)
- ☐ Settlement agreements, invoices, and board minutes supporting one-time expense claims
- ☐ Revenue schedule identifying any non-recurring or windfall revenue inflating TTM results
Analytical Steps
- ☐ Reconstruct the EBITDA bridge independently, do not start from the borrower’s schedule
- ☐ Categorize every add-back into the three-layer taxonomy (definitional / quality-of-earnings / normalization)
- ☐ Independently benchmark all owner compensation, rent, and related-party items, do not accept borrower representation without market data
- ☐ Apply a 12-month realization test to all projected synergies; haircut unrealized savings by at least 50%–67%
- ☐ Calculate lender-adjusted leverage (Debt ÷ Lender EBITDA) and compare to borrower-presented leverage
- ☐ Stress-test at –20% and –30% EBITDA; confirm ICR and DSCR at each level against covenant thresholds
- ☐ Build the lender credit memo with a parallel column showing borrower EBITDA vs. lender EBITDA
Questions to Ask in Diligence
- ☐ Has any "one-time" item appeared in more than one period over the trailing three years?
- ☐ What percentage of total adjusted EBITDA comprises run-rate savings or projected synergies that have not yet been realized?
- ☐ Are any revenue adjustments downward, i.e., has the borrower or sponsor identified non-recurring revenue that inflates TTM results?
- ☐ What is the replacement cost of the owner’s role at an arm’s-length market rate, not what the borrower claims they would pay?
- ☐ What does the business look like at 80% of lender-adjusted EBITDA? Can it service debt and remain covenant-compliant?
Key Takeaways
- The EBITDA bridge is an opinion, not a fact. Borrower-submitted adjusted EBITDA reflects management’s best case. The lender’s job is to reconstruct it independently and challenge every assumption with documentation and benchmarks.
- Add-back composition matters more than size. A 15% adjustment comprising fully documented, non-recurring items is far safer than a 15% adjustment dominated by unrealized projected synergies. Know what is inside the number, not just its magnitude.
- Stressed leverage is the real underwriting metric. The base-case leverage ratio is a starting point. The underwriting decision should be made on the basis of what leverage and coverage look like at –20% to –30% EBITDA, because that scenario has a meaningful historical probability of occurring.
- The covenant EBITDA definition and the underwriting EBITDA should be kept separate. Covenant definitions may permit adjustments that a disciplined credit officer still haircuts for underwriting conservatism. The credit approval should reflect the lender’s view, not the definition in the credit agreement.
- Recovery starts at underwriting. The empirical data on senior secured middle-market recovery (approximately 69% on average, with software and recurring-revenue businesses supporting 70%–90%) reflects structural advantages: first lien, maintenance covenants, tight collateral packages. Those advantages erode when the underlying EBITDA used to size debt was overstated from day one. Documentation and discipline at origination determine which end of the recovery range you earn.


