
Underwriting & Risk Management
EBITDA Adjustments and Normalization in Credit Underwriting: A Practitioner’s Framework for Lender-Adjusted Cash Flow
The Underwriting Question Every Lender Must Answer
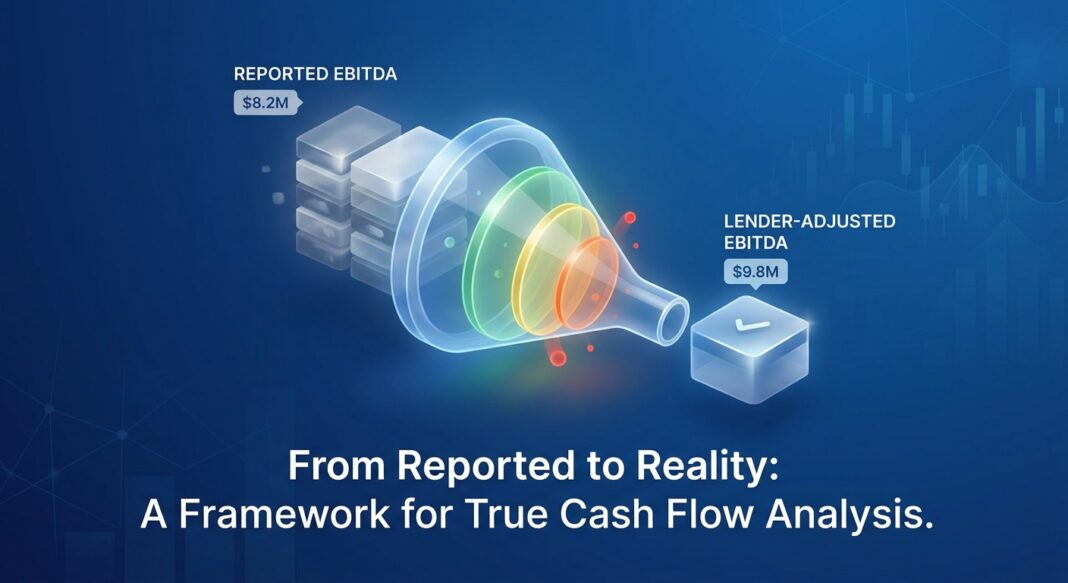
A sponsor presents a manufacturing business with $8.2 million in reported EBITDA. The CIM lists $11.4 million in adjusted EBITDA after $3.2 million in add-backs: a 39% uplift driven by one-time restructuring costs, owner compensation normalization, a settled litigation charge, and projected synergies from a recently completed bolt-on acquisition. The proposed debt load is $57 million, implying 5.0x leverage against adjusted EBITDA. Against reported EBITDA, that leverage climbs to 6.9x. Which number should the underwriter use, and how confident can they be in it?
This is the central tension in middle-market and leveraged credit underwriting. EBITDA adjustments are not inherently problematic; many are legitimate, well-documented, and essential for accurately reflecting a business’s ongoing earning power. But the underwriting stakes are high. Accepted add-backs directly change leverage ratios, debt service coverage ratios (DSCR), and covenant headroom. They can transform a marginal credit into an approved one. The difference between borrower-adjusted EBITDA and lender-adjusted EBITDA is not just an accounting exercise; it is a risk decision with material portfolio implications.
The current credit environment makes this discipline even more critical. The Financial Stability Board’s May 2026 report on private credit vulnerabilities noted that leverage in private credit markets sits at 5–6x debt-to-EBITDA based on headline figures, but warns that the true leverage, after accounting for aggressive EBITDA adjustments, could be closer to 7x. For underwriters, that gap is not noise. It is credit risk.
The Analytical Framework: From Reported to Lender-Adjusted EBITDA
The job of the credit underwriter is to construct a defensible, independently verified EBITDA figure that reflects the business’s true, sustainable, debt-servicing cash flow. This means applying a disciplined three-layer process:
Layer 1: Start With Audited Financials, Not the CIM
Begin with three years of audited (or CPA-reviewed) financial statements and the trailing twelve months (TTM). The CIM’s EBITDA schedule is the seller’s advocacy document. The underwriter’s normalized EBITDA is an independent analytical construct built from source documents. Every adjustment must be traced to a specific line item in the financials, a supporting invoice, contract, or third-party benchmark, never taken at face value from a management presentation.
The IOSCO June 2024 report on leveraged loans and CLOs was direct on this point: EBITDA definitions should avoid unnecessary complexity, and “pro-forma EBITDA adjustments based on future synergies, earnings and asset disposals should be made on a reasonable basis and borrowers are encouraged to provide clear justifications.” Institutional underwriters go further; they apply their own independent scrutiny to every adjustment, regardless of how it is presented in loan documentation.
Layer 2: Classify Each Adjustment by Category and Risk
Not all adjustments carry equal risk. An experienced underwriter classifies each add-back into one of four buckets:
- Green (High Acceptance): Transaction advisory fees, non-recurring litigation settlements, one-time system implementation costs: items clearly documented, event-specific, and non-repeating. These are generally accepted at face value with supporting invoices.
- Yellow (Haircut Required): Owner compensation normalization, related-party rent adjustments, management fee eliminations. These are legitimate but require third-party benchmarks (e.g., BLS Occupational Employment Statistics for comp, CoStar for rent comparables) and are typically accepted at 75–90 cents on the dollar by conservative underwriters.
- Orange (Elevated Scrutiny): Run-rate cost savings from headcount reductions or facility closures not yet fully realized. These require a documented implementation timeline, evidence of actions already taken, and a credible cap on the adjustment horizon, typically no more than 12–18 months of forward-looking benefit.
- Red (Reject or Deep Haircut): Uncaptured synergies from acquisitions closed less than six months ago, normalized EBITDA for businesses acquired but not yet integrated, COVID-era normalizations presented in 2025 or 2026, and any adjustment lacking primary source documentation. These should be rejected or haircut to zero in the lender’s credit model.
Layer 3: Build the Lender-Adjusted EBITDA Schedule
The output is a side-by-side schedule showing: (1) Reported EBITDA, (2) Borrower-Adjusted EBITDA, and (3) Lender-Adjusted EBITDA. Every line must reference its documentation. The lender-adjusted figure becomes the base for all credit metrics: leverage ratio, DSCR, interest coverage, and covenant compliance calculations.
Walking Through the Calculations: A $10M EBITDA Manufacturing Example
Consider a hypothetical precision-components manufacturer with the following borrower-proposed adjustment schedule:
| Adjustment Item | Borrower Claim | Lender Decision | Lender Amount | Rationale |
|---|---|---|---|---|
| Reported EBITDA | $8,200,000 | Accepted | $8,200,000 | Audited financials |
| M&A transaction fees (one-time) | +$620,000 | Accepted (Green) | +$620,000 | Invoices from legal/advisory firms on file |
| Owner compensation normalization | +$480,000 | Haircut (Yellow) | +$360,000 | BLS benchmark supports $140K market rate; 25% haircut applied to excess comp delta |
| Litigation settlement (one-time) | +$310,000 | Accepted (Green) | +$310,000 | Settlement agreement and court documents provided |
| Run-rate savings from plant consolidation | +$750,000 | Haircut (Orange) | +$375,000 | Consolidation 40% complete; 50% haircut pending full execution evidence |
| Projected synergies from bolt-on (not yet closed) | +$1,040,000 | Rejected (Red) | $0 | Acquisition not closed; no integration evidence; exceeds 12-month horizon |
| Lender-Adjusted EBITDA | $11,400,000 | $9,865,000 | Net reduction: $1,535,000 vs. borrower |
How This Flows Into Credit Metrics
With $57 million in proposed debt and annual debt service of approximately $6.8 million (blended interest + amortization at current rates), the difference between borrower and lender EBITDA is not academic:
- Borrower-Adjusted Leverage: $57M ÷ $11.4M = 5.0x: within many institutional lenders’ policy limits.
- Lender-Adjusted Leverage: $57M ÷ $9.865M = 5.78x: above typical middle-market thresholds of 5.0–5.5x.
- Borrower DSCR: $11.4M ÷ $6.8M = 1.68x: comfortable coverage.
- Lender-Adjusted DSCR: $9.865M ÷ $6.8M = 1.45x: still above the minimum 1.25x threshold, but with limited headroom for EBITDA deterioration.
This is why the add-back review is the highest-leverage analytical step in credit underwriting. A $200,000 swing in accepted add-backs at 1.0x annual debt service moves a DSCR from 1.15x (decline) to 1.35x (approval). As Crediflow’s credit analysis framework notes: “that difference can change a decline into an approval, so the evidence standard should match the impact.”
Stress Testing the Normalized EBITDA
Once lender-adjusted EBITDA is established, a disciplined underwriter stress-tests it. Apply a base, adverse, and severe scenario to the lender-adjusted figure, not the borrower’s optimistic projection. A standard middle-market stress matrix: (1) Base case: flat EBITDA, current rates; (2) Adverse: 10% EBITDA decline, +50bps on floating rate, S&P analysis found this scenario pushes over 25% of leveraged middle-market borrowers below 1.0x coverage; (3) Severe: 20–25% EBITDA decline with a refinancing event. Under the severe scenario in this example, EBITDA drops to $7.9M, DSCR falls to 1.16x, and leverage breaches a typical 6.0x covenant threshold. That is useful information for covenant design.
Industry Standards, Market Data, and Red Flags
What Institutional Lenders Look For
The market standard for middle-market private credit deals under $50 million EBITDA includes at least one financial maintenance covenant, most commonly a total leverage ratio test with meaningful headroom above closing leverage. Larger deals increasingly accept covenant-lite structures, but the FSB’s May 2026 private credit vulnerability report makes clear that “covenant-lite documentation, payment in kind (PIK) income, NAV-based lending, and layered fund-level leverage” have expanded in ways that obscure underlying risk, a direct consequence of aggressive EBITDA definitions being used to size facilities and set covenant thresholds.
Cambridge Associates’ April 2026 analysis of direct lending dispersion observed that competitive pressures have weakened lender protections across the core middle market, and that even where covenants remain, “aggressive EBITDA adjustments, unrealistic financial projections, and loose definitions often weaken them and create a false sense of protection.” Disciplined lenders in the lower-middle market and specialty finance space are differentiating themselves precisely by maintaining tighter add-back standards.
📊 Credit Performance Data Box
- Leveraged loan default rate (trailing 12M, Sept. 2025): 5.9% issuer-weighted, compared to a 3.4% historical long-run average, per Moody’s. Moody’s projects the rate could rise above 7% in H1 2026.
- Speculative-grade default rate (U.S., Oct. 2025): 4.4% trailing 12 months, per S&P Global Ratings, with distressed exchanges continuing to account for a large share of year-to-date defaults.
- Distressed exchanges as % of all defaults (2025): Approximately 65% of all corporate defaults in 2025 were distressed restructurings, the highest annual share on record, per Moody’s Ratings. S&P data puts the figure at roughly 52–56% through mid-2025.
- First-lien senior secured recovery rate (2024 Moody’s forecast): 57.6%, below the long-term average of 65.0%, driven by structural deterioration, weak credit quality, and flexible documentation that delays hard defaults.
- EBITDA adjustment magnitude (IOSCO 2024): Market estimates indicate incurrence covenants in current leveraged loan deals are subject to EBITDA adjustments of 15–30%. S&P found that for deals originated 2015–2019, borrowers under-projected leverage by an average of 2.2x EBITDA in year one and 2.9x EBITDA in year two.
- Repeat default risk after distressed exchange: A 2023 S&P study found 35% of distressed exchanges resulted in a repeat default within 48 months, meaning a distressed exchange is often a delay, not a resolution.
Top Red Flags in EBITDA Adjustment Schedules
- Adjustment magnitude exceeds 20% of reported EBITDA. Anything above this threshold warrants a line-by-line rejection analysis. The larger the adjustment as a percentage of reported earnings, the higher the execution risk if those add-backs fail to materialize post-close.
- Forward-looking synergies with no time-bound documentation. Synergies from integrations, cost restructurings, or new contracts that have not yet been realized should be capped, time-limited, and haircut significantly. IOSCO guidance specifically calls for credible time horizons and caps on these adjustments.
- Owner compensation normalized to a number that still requires a capable replacement. Only the excess above a legitimate market-rate salary for the role should be added back. A lender must budget for a real operator, not assume the owner’s labor is free post-transaction.
- COVID or macro-normalization items persisting into 2025–2026 filings. These adjustments have near-zero acceptance rates with informed buyers and lenders as of 2026. Their presence signals either aggressive packaging or poor financial advisory.
- Related-party transactions at non-market terms with no third-party comparables. Above-market rent, below-market management fees, or intercompany loans without arms-length pricing require normalized treatment supported by independent benchmarks.
- A single large add-back that drives deal viability. If removing one adjustment breaks the deal economics, that item deserves maximum scrutiny. No single add-back should be load-bearing to the underwriting thesis.
Underwriting Checklist: EBITDA Normalization Diligence
The following checklist reflects the documentation and analytical standards expected by institutional credit committees for middle-market transactions:
Documentation Requirements
- ☐ Three years of audited (or CPA-reviewed) financial statements, no compilation-only financials above $5M EBITDA
- ☐ Trailing twelve-month (TTM) income statement with monthly detail to assess seasonality and trend
- ☐ Borrower’s formal EBITDA bridge / adjustment schedule with line-item descriptions
- ☐ Supporting invoices or contracts for every claimed one-time item above $50,000
- ☐ BLS or comparable salary survey for owner/executive compensation benchmarking
- ☐ CoStar, LoopNet, or independent broker opinion for any related-party real estate adjustment
- ☐ Integration or restructuring plan with milestones, timeline, and sign-off from management for any run-rate savings
Analytical Steps
- ☐ Build the lender-adjusted EBITDA schedule independently, do not simply start from the borrower’s schedule
- ☐ Classify each adjustment into Green / Yellow / Orange / Red using the framework above
- ☐ Apply haircuts to Yellow and Orange items; document all rejections in the credit memo
- ☐ Recalculate total leverage (Debt / Lender EBITDA), interest coverage (EBITDA / Total Interest), and DSCR (EBITDA / Total Debt Service) using lender-adjusted EBITDA
- ☐ Confirm all covenant definitions use the same lender-adjusted EBITDA base as the credit model
- ☐ Run three-scenario stress test: Base, Adverse (–10% EBITDA), Severe (–20–25% EBITDA) with corresponding rate sensitivity
- ☐ Identify the single largest add-back; stress test the deal with that item removed entirely
Questions to Ask Management
- ☐ Have any of these adjustments recurred in prior years? Show the last three years of actuals for each add-back category.
- ☐ For cost savings: What specific actions have already been taken? What is the dollar savings per action and the expected completion date?
- ☐ For acquisition synergies: Are they dependent on a deal that has not yet closed? What is the integration track record?
- ☐ Who prepared the adjustment schedule: management, a QoE firm, or an investment bank? Has any independent Quality of Earnings report been completed?
Key Takeaways
- Lender-adjusted EBITDA is a risk decision, not an accounting exercise. Every accepted add-back moves leverage ratios, DSCR, and covenant headroom. The evidence standard must match the dollar impact of each item.
- Adjust magnitude is a risk signal. IOSCO data shows current leveraged loan deals carry EBITDA adjustments of 15–30% of reported earnings. FSB analysis warns that headline leverage of 5–6x in private credit may reflect true leverage closer to 7x once adjustments are stress-tested. Underwriters who anchor on borrower-adjusted figures inherit that risk.
- The default environment rewards conservatism. With distressed exchanges accounting for approximately 65% of all corporate defaults in 2025, the highest annual share on record per Moody’s, and first-lien recovery rates below historical norms at 57.6% (Moody’s, 2024), the cost of inflated EBITDA in a stressed scenario is a lower-than-modeled recovery, not just a covenant breach.
- Stress testing is only as good as the EBITDA base it runs on. S&P analysis shows that even a mild adverse scenario, 10% EBITDA erosion with a 50bps rate increase, pushes over 25% of middle-market leveraged borrowers below 1.0x coverage. Running that scenario on inflated, borrower-adjusted EBITDA produces a false sense of resilience.
- Covenant design must use the same adjusted EBITDA as the credit model. A maintenance covenant set at 6.0x leverage against borrower-adjusted EBITDA offers far less protection than the same covenant tested against lender-adjusted EBITDA: especially when distressed exchanges, which often involve maturity extensions and covenant resets, now represent the modal default path.


