
Underwriting & Risk Management — Credit Analysis
EBITDA Normalization in Credit Underwriting: How Lenders Validate, Stress-Test, and Size Debt Against Adjusted Earnings
The Underwriting Question Every Deal Starts With
A sponsor sends over a Confidential Information Memorandum. The headline reads: $10.4M Adjusted EBITDA. Manufacturing business. Consistent growth. Low customer concentration. A clean story. But before a single dollar of debt is committed, the most consequential question in credit underwriting must be asked: how much of that $10.4M is real, recurring, and financeable?
EBITDA normalization is the discipline of answering that question systematically. It separates the earnings a business will actually generate from the earnings a seller needs to present in order to achieve a target valuation. The gap between the two determines how much debt can be safely structured, what covenants are appropriate, and whether a deal should close at all.
This discipline has never mattered more. According to the Financial Stability Board’s May 2026 report on private credit vulnerabilities, headline leverage in private credit portfolios could be closer to 7x debt-to-EBITDA on a “true” basis once inflated EBITDA adjustments are removed — significantly above the reported 5–6x figures. And as of Q4 2025, approximately 25% of middle-market borrowers carried sub-1.0x interest coverage ratios, according to KBRA’s Direct Lending Compendium. Inflated EBITDA at origination is a leading cause of both outcomes.
Understanding the full normalization methodology — and where it breaks down — is a foundational competency for every credit professional.
The Analytical Framework: Building a Lender-Adjusted EBITDA Bridge
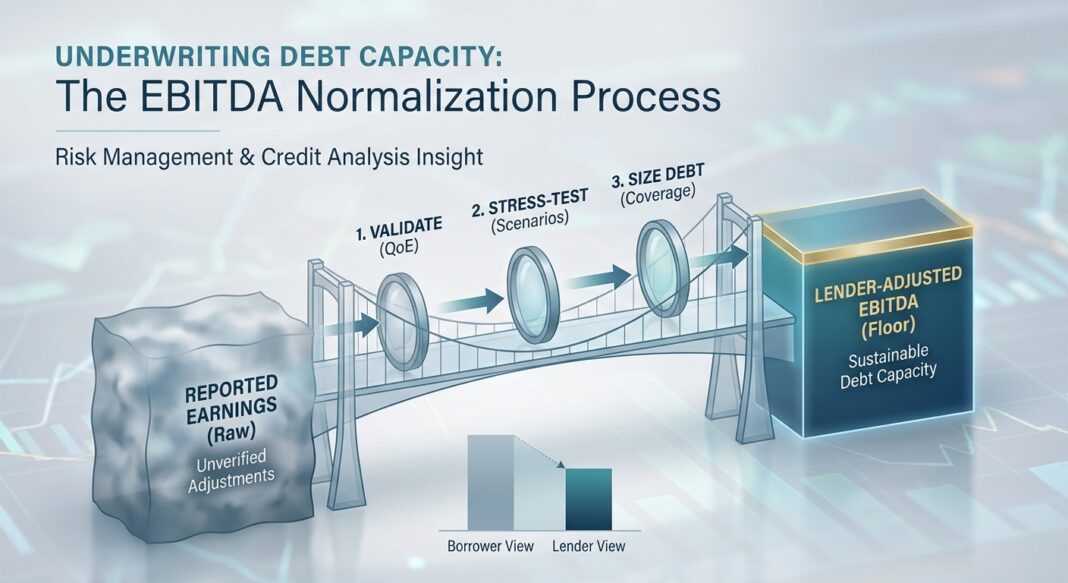
Effective EBITDA normalization requires constructing two distinct numbers and a transparent bridge between them. The cleanest credit memo shows both borrower-adjusted EBITDA and lender-adjusted EBITDA, with every divergence explicitly documented and defended.
Step 1 — Start With Reported EBITDA
Reported EBITDA is the figure derived directly from the income statement: net income plus interest, taxes, depreciation, and amortization. This is the baseline. It may include owner-specific distortions, non-recurring items, and related-party transactions that distort the true economics of the enterprise.
Step 2 — Apply the Three Normalization Categories
Adjustments fall into three categories, each with a different risk profile:
- Quality-of-Earnings Adjustments: Back out genuinely one-time items — a settled lawsuit, a building sale, severance from a non-recurring layoff. These are the most defensible add-backs when fully documented.
- Normalization Adjustments: Correct items that are recurring but priced incorrectly — owner compensation above market rate, related-party rent above or below market, family members on payroll without verifiable roles. These require independent benchmarking to be credible.
- Pro Forma Adjustments: Reflect the annualized run-rate impact of completed acquisitions, cost saves, or new contracts. These are the highest-risk category and should be haircut aggressively unless supported by signed contracts or realized performance data.
Step 3 — Apply the CARVE Test to Every Add-Back
A practical decision framework for lenders: if the cost is needed to generate revenue, serve customers, meet compliance requirements, or maintain the asset base, it should remain in EBITDA and not be added back. An add-back that passes only two of five CARVE criteria should be haircut or excluded entirely, even when the borrower presents it as normalized earnings.
Step 4 — Establish the Lender-Adjusted EBITDA Floor
The lender’s underwriting model should use a conservative, independently derived adjusted EBITDA. The corollary: seller-provided add-back schedules are a starting point, not a conclusion. Independent QoE providers commonly disallow 10% to 30% of the add-backs a seller proposes after testing whether items genuinely will not recur.
| Item | Amount | Lender Assessment |
|---|---|---|
| Reported EBITDA | $7,800,000 | Baseline |
| + Owner comp normalization (above-market salary) | $620,000 | Accept — BLS-benchmarked, documented |
| + Related-party rent normalization | $310,000 | Accept — CoStar comparable provided |
| + One-time legal settlement | $480,000 | Accept — settlement agreement in data room |
| + “One-time” equipment refurbishment (recurring 3 years) | $195,000 | Reject — appeared in each of past three years |
| + Pro forma synergy from bolt-on | $400,000 | Haircut 50% — synergies not yet realized |
| + Stock-based compensation | $185,000 | Reject — retained as ongoing compensation cost |
| Borrower-Claimed Adjusted EBITDA | $9,990,000 | — |
| Lender-Adjusted EBITDA (Conservative Floor) | $9,010,000 | $980K removed or haircut |
At a 6x multiple, each $100,000 of EBITDA removed from the borrower’s figure reduces enterprise value by $600,000 and directly reduces serviceable debt capacity.
From Normalized EBITDA to Debt Sizing: Coverage Ratios and Covenant Calibration
Once lender-adjusted EBITDA is established, it becomes the denominator for every key credit metric. The three coverage tests that govern debt structuring in the lower middle market are materially different in what they capture — and a borrower can pass one while failing another.
The Three Coverage Tests
- Interest Coverage Ratio (ICR): EBITDA ÷ Annual Cash Interest. Measures ability to service interest only. Easy to pass with floating-rate debt at moderate leverage.
- Debt Service Coverage Ratio (DSCR): Net Operating Income (or EBITDA − taxes − capex) ÷ (Principal + Interest). For middle-market cash-flow loans, most lenders require a minimum of 1.25x, meaning earnings must cover all debt obligations by at least 25%.
- Fixed Charge Coverage Ratio (FCCR): (EBITDA − capex − taxes − distributions) ÷ (Principal + Interest + Lease Payments). This is the most conservative and, in lower middle-market credit agreements, the most binding maintenance covenant. Most lenders set FCCR covenant minimums between 1.10x and 1.50x.
According to Lincoln International’s Q1 2026 data cited by Kaden Wood Group, fixed charge coverage across a large middle-market sample sat at 1.3x in Q1 2026 — the third consecutive quarter at that level and up from a 1.1x trough in Q1 2024. Critically, however, 19.5% of borrowers remained below 1.0x FCCR, down from a 40.9% peak in Q2 2024 but still a material portion of the portfolio operating without adequate debt service capacity.
Stress-Testing Coverage Ratios
The useful number in coverage analysis is not the ratio itself — it is the distance to the covenant. An FCCR of 1.31x against a 1.20x minimum covenant means earnings can decline approximately 8% before a breach occurs. Against a 1.30x minimum, that same deal has almost no operating margin. Underwriters should routinely model three scenarios:
- Base Case: EBITDA growth of ~3%, stable rates — verify coverage holds above 1.25x FCCR throughout the loan term.
- Adverse Case: EBITDA down 10%, rates unchanged — S&P data suggests roughly 25% of middle-market firms fall below 1.0x interest coverage in this scenario.
- Severe Case: EBITDA down 20% — identifies structural stress and informs whether a deal should be passed, resized, or re-equitized.
Debt Sizing Against Normalized EBITDA
Lower middle-market first-lien debt averaged 4.5x leverage (Debt/EBITDA) as of late 2024, according to PGIM, compared to 5.8x in the broadly syndicated loan market. GF Data’s Q3 2025 report found that for the $25M–$50M enterprise value cohort, total debt-to-EBITDA averaged 4.0x and senior debt-to-EBITDA averaged 3.4x. These benchmarks inform what is appropriate leverage at each tier — and when a proposed capital structure is out of market.
Industry Standards, Red Flags, and Credit Performance Data
What Institutional Lenders Look For
Experienced institutional credit teams approach every EBITDA bridge with structured skepticism. The standard is clear: an add-back that cannot be traced to a primary source document — invoice, settlement agreement, payroll record, or independent market comparable — does not exist as a verified adjustment. An undocumented expense line should be rejected outright, not discounted or partially accepted pending further information.
Three institutional standards now anchor best practice:
- Independent QoE mandatory at origination: Effective October 1, 2026, the SBA’s SOP 50 10 8.1 requires an independent Quality of Earnings report for qualifying 7(a) change-of-ownership acquisitions. The lender must use QoE-derived earnings — not borrower-adjusted EBITDA — in the Debt Service Coverage determination. Critically, the QoE must be prepared for the benefit of the lender, not the borrower or seller.
- Stock-based compensation retained as an expense: In 2026 sponsor practice, SBC is almost always retained as an expense in the buyer’s underwriting model regardless of the seller’s QoE treatment. Buyers underwriting against an adjusted EBITDA that adds back SBC typically reduce the entry multiple by 0.5x to 1.0x turns to compensate.
- Maintenance covenants in smaller transactions: Maintenance covenants remain the norm in smaller transactions, and the FCCR test is the one that captures amortization, capital expenditure, and taxes together — making it the binding constraint for most lower middle-market borrowers.
Red Flags to Watch For
- Recurring “one-time” items: An equipment refurbishment or IT upgrade appearing in three consecutive years is an operating cost, not an add-back. QoE providers systematically reject these.
- Vague miscellaneous add-backs: Any undocumented line without a traceable GL entry is a structural red flag.
- Aggressive pro forma synergies: Pro forma EBITDA adjustments based on projected cost savings and unrealized synergies are highly uncertain — prior research in the leveraged loan market shows most forward synergy adjustments miss their targets, per the FSB’s May 2026 private credit report.
- Missing replacement cost analysis: If a below-market owner salary is not deducted from EBITDA, the lender is extending credit against earnings that are unsustainable under any realistic management scenario.
- Payment-in-kind (PIK) financing as a stress signal: Rising PIK structures indicate borrowers are unable to service cash interest. As of Q1 2026, loans carrying PIK toggle features represented 8.9% of total interest income in one large middle-market lender survey, with loans that converted to PIK post-origination reaching 5.9% — described as a “shadow default rate.”
📊 Credit Performance Data (2025–2026)
- Middle-market leveraged loan default rate: Estimated at 1.6% to 4.7% for private credit direct lending in 2025 when distressed exchanges are excluded, per Moody’s July 2025 analysis.
- KBRA’s Q4 2025 default monitor: 3.4% by count and 2.0% by value across its rated direct lending portfolio; 81 companies in the default monitor comprising 17 payment defaults and 64 CCC-minus assessments.
- S&P speculative-grade default rate: Reported above 4% in late 2025; S&P forecast a decline to approximately 4% by September 2026.
- Recovery rates (Secured vs. Unsecured): Senior secured bonds achieved approximately 56% recovery compared to 37% for senior unsecured bonds in default scenarios.
- FSB leverage warning: True Debt/EBITDA leverage in private credit may be closer to 7x once EBITDA adjustments are normalized, versus reported 5–6x headline figures.
- Lincoln International Q4 2025: FCCR at 1.3x (Q1 2026); covenant default rate flat at 3.2%; amendment activity up 13% quarter-over-quarter; sponsor equity infusions up 31%.
- Middle-market EBITDA growth: Lincoln Private Market Index recorded full-year 2025 EBITDA growth of 4.7%, decelerating from 6.5% in Q2 to 4.7% in Q4 — growth is positive but slowing, compressing headroom for over-levered borrowers.
The EBITDA Normalization Underwriting Checklist
Before committing to a debt sizing, every credit underwriter should complete the following diligence steps against the borrower’s adjusted EBITDA schedule:
- Reconcile to filed tax returns and IRS transcripts. Internal financials, management accounts, and GAAP statements must all tie. Unexplained gaps between management EBITDA and tax-return income require written explanation before any add-back analysis begins.
- Build an independent add-back schedule from the GL up. Every proposed add-back must reference a specific GL line, supported by an invoice, payroll record, board minute, or settlement agreement. No verbal justifications. No undocumented line items.
- Apply the prior-year recurrence test. Has this “one-time” item appeared in each of the last two or three years? If yes, reject the add-back or reclassify it as a recurring operating cost.
- Benchmark owner compensation independently. Use BLS Occupational Employment Statistics or equivalent salary surveys for the relevant role and geography. Only excess compensation above market rate qualifies as a defensible add-back. Missing salary deductions for below-market owner pay must also be applied.
- Normalize related-party transactions to arm’s-length market rates. Related-party rent should be tested against CoStar or broker comparables. Any management fees, consulting arrangements, or intercompany charges require independent verification.
- Reject or deeply haircut pro forma synergies. Accept run-rate add-backs for cost savings only when supported by signed contracts or at least two quarters of realized performance. Assign a 50% haircut minimum on unrealized synergies.
- Build the two-column EBITDA bridge. Document borrower-adjusted EBITDA, lender-adjusted EBITDA, and every line of divergence. This becomes the baseline for DSCR calculations and covenant-setting.
- Run the three coverage ratio tests against lender-adjusted EBITDA. ICR, DSCR, and FCCR should all be calculated. Identify the binding covenant and stress-test it with base, adverse, and severe EBITDA decline scenarios.
- Validate debt sizing against market benchmarks. Lower middle-market senior debt should generally not exceed 3.5x–4.5x lender-adjusted EBITDA. Total leverage above 5.5x requires documented rationale and higher covenant protections.
- Document everything in the credit file. Under SBA SOP 50 10 8.1 (effective October 1, 2026), the QoE report and its derived earnings figure must be retained in the credit file and serve as the basis for the DSC determination. This standard represents institutional best practice for all acquisition lending, not just SBA transactions.
Key Takeaways
- Borrower-adjusted EBITDA is a proposal, not a conclusion. Lenders must build their own independent EBITDA figure from the general ledger up, testing every add-back with source documentation before it enters the debt-sizing model.
- 10%–30% of proposed add-backs do not survive independent QoE scrutiny. At a 6x multiple, each $100,000 removed from EBITDA eliminates $600,000 of enterprise value and directly reduces maximum supportable debt. Originating against inflated EBITDA is one of the primary drivers of post-close covenant breaches.
- True leverage in private credit may be substantially higher than reported. The FSB estimates that Debt/EBITDA in private credit portfolios could approach 7x on a true basis — versus the 5–6x headline figures — when EBITDA adjustments are properly normalized. This understated leverage compounds downside risk in adverse scenarios.
- FCCR is the binding covenant in most lower middle-market structures. Unlike interest coverage, FCCR captures amortization, capex, taxes, and leases — making it the most conservative and most predictive test of debt service capacity. As of Q1 2026, nearly 20% of middle-market borrowers remained below 1.0x FCCR.
- Rising PIK ratios are a real-time stress signal within any portfolio. PIK conversions post-origination represent a “shadow default rate” not captured in headline statistics. Portfolio monitoring must track PIK prevalence, amendment frequency, and coverage ratio trajectories — not just payment performance — to identify deteriorating credits before they reach formal default.
Sources & Further Reading
- Financial Stability Board — Report on Vulnerabilities in Private Credit, May 2026
- Lincoln International — Q2 2026 Lincoln Private Market Index
- Lincoln International — Q4 2025 Private Market Index / LPMI Full-Year 2025 Summary, February 2026
- KBRA — Private Credit: Q4 2025 Middle Market Borrower Surveillance Compendium, February 2026
- Moody’s Ratings — US Corporate Default Risk in 2026: Default Rates are Easing, Credit Risk is Fragmented and Fragile
- S&P Global Ratings / Raymond James — Q4 2025 Debt Market Insight
- GF Data — Q3 2025 ESOP Advisor Leverage Report (via CapitalPad)
- SBA Standard Operating Procedure 50 10 8.1 — QoE Requirement, effective October 1, 2026
- Kaden Wood Group — Fixed Charge Coverage Ratio vs DSCR vs Interest Coverage, 2026
- PGIM / ABF Journal — Leverage Limits: Stress-Testing Middle Market Debt Capacity, 2025
- CrediFlow — EBITDA Adjustments in Credit Analysis: The CARVE Test, 2026
- Papermark — Quality of Earnings in 2026: 8 Adjustments and the Add-Back Trap
- Bonadio Group — The SBA Just Raised the Bar on Deal Diligence, September 2026


