
Bond Capital | Market & Sector Intelligence | September 30, 2026
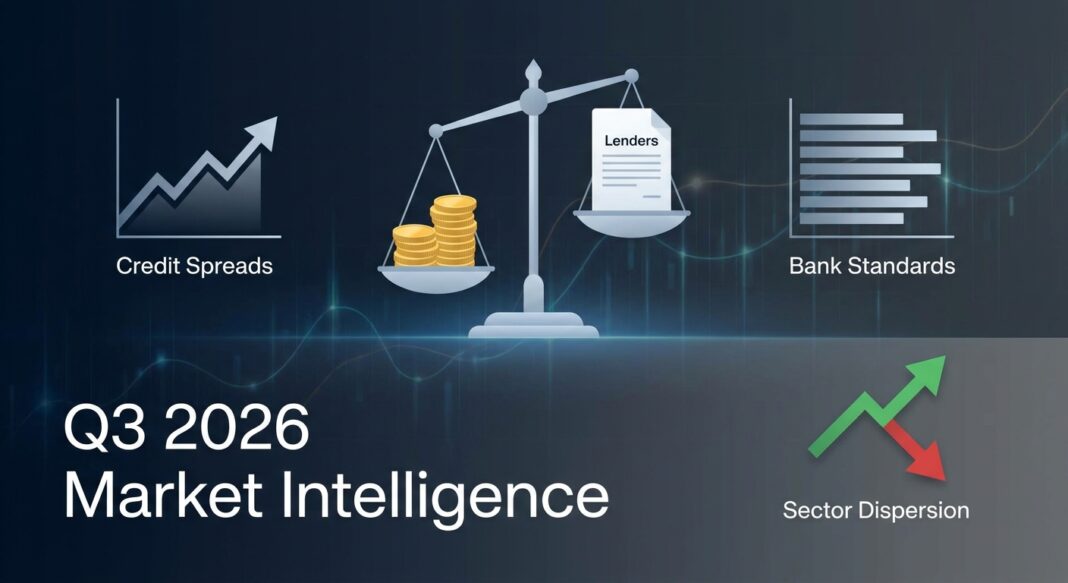
The Lender-Friendly Reset: Private Credit Spreads Widen, Bank Standards Stabilize, and Sector Dispersion Accelerates
A confluence of macro, regulatory, and structural forces has shifted negotiating leverage back to disciplined lenders — but the opportunity is not evenly distributed.
Market Headline: The Cycle Turns — Lenders Regain the Upper Hand
For institutional investors and operating executives who rely on credit markets to finance acquisitions, recapitalizations, and growth, Q3 2026 marks a decisive inflection point. After an extended period in which abundant dry powder and scarce deal flow handed borrowers exceptional pricing power, a confluence of forces — rising M&A volumes, geopolitical volatility, AI-driven disruption of software portfolios, and accelerating redemptions from Business Development Companies (BDCs) — has reset the supply-demand balance squarely in favor of disciplined lenders.
The evidence is clear and quantifiable. Hamilton Lane reports that private credit spreads have moved back into the SOFR+500 basis-points context, recovering from the mid-400 bps level that prevailed in late 2025. Lord Abbett confirms this structural reset: the conditions that previously favored borrowers — tighter spreads, higher leverage, and more flexible documentation — have reversed as the market transitions from a liquidity-surplus to a demand-growth phase. Meanwhile, the July 2026 Federal Reserve SLOOS confirms that bank C&I lending standards for large and middle-market firms registered at 0.0% net tightening in Q3, signaling a stabilization from the tightening trend that ran from Q3 2025 through Q2 2026 — but also confirming banks have not materially re-entered the leveraged lending space at scale.
The macro backdrop compounds these dynamics. Morgan Stanley Investment Management notes that the Federal Reserve remained on hold through H1 2026, inflation proved more persistent than expected, and AI-driven disruption contributed to a sharp repricing across parts of the software sector — all of which have widened spreads in both direct lending and the broadly syndicated market. The result: for the first time since 2023, lenders are once again earning meaningfully greater compensation for risk.
Quantitative Market Snapshot
The following data table synthesizes the most current market metrics across public and private credit markets as of Q3 2026. Each metric is sourced directly from institutional market data providers.
| Metric | Current Value (Q3 2026) | Prior Period | Change | Source |
|---|---|---|---|---|
| Private Credit (Direct Lending) Spreads — Large Cap | SOFR + ~500 bps | SOFR + mid-400s bps (Q4 2025) | +~50–75 bps wider | Hamilton Lane (Apr 2026) |
| Private Credit Spreads — Software / SaaS Sector | ~100–150 bps wider vs. prior year | Pre-AI disruption levels (2025) | +100–150 bps wider | Partners Group (2026) |
| Lower Middle Market (LMM) Spread Premium Over Large Cap | +232 bps (Q3 2025; widening trend continuing) | Pre-2025 average ~150–180 bps | Widening | Avante Capital / NEPC via LSEG LPC |
| Direct Lending All-In Yields (Senior Secured, First Lien) | 10%–13%+ (middle market) | 8.0%–8.5% trough projected for 2026 (large cap) | Elevated; above trough | HedgeCo.net / Morgan Stanley (2026) |
| High Yield Bond All-In Yield (US HY Index) | ~7.87% (spread: ~293 bps over Treasuries) | ~7.3% (H1 2026) | Widening | StreetStats / ICE BofA (Sep 25, 2026) |
| Private Credit vs. High Yield Spread Premium | ~150–200 bps (compressed from ~350 bps in 2019) | ~350 bps (2019) | Significantly compressed | Owners.pe (Apr 2026) |
| Private Debt Issuance Volume (YTD through May 2026) | ~$87.2B (Jan–May 2026) | ~$115.7B equivalent (Jan–May 2025) | –24.6% YoY | Valuation Research Corp (Q2 2026) |
| Direct Lending Issuance (Q2 2026) | $32.9B (Q2 2026) | $74.1B (Q1 2026) | –55.5% QoQ | Capstone Partners / PitchBook LCD (Q2 2026) |
| Borrower Debt/EBITDA (Private Credit, Headline) | 5x–6x (external sources); ~7x adjusted (FSB est.) | ~4x in leveraged loans | Elevated; EBITDA addbacks raise true leverage | FSB Report on Private Credit Vulnerabilities (May 2026) |
| Middle-Market EBITDA-to-Interest Coverage (FCCR proxy) | ~1.7x–1.8x average | ~2.0x–2.2x (pre-rate-hike cycle) | Tightening under elevated rates | Columbia Threadneedle / S&P (2026) |
| Fed SLOOS — Net % Banks Tightening C&I Standards (Large & Mid-Market) | 0.0% (Q3 2026) | +8.1% tightening (Q2 2026); +9.5% (Q3 2025) | Stabilized — net neutral | Federal Reserve FRED / SLOOS (Aug 3, 2026) |
| Private Credit Default Rate (2025, incl. distressed exchanges) | ~1.6%–4.7% (range depending on DE inclusion) | Sub-1.5% (2021–2023) | Rising; DE = ~65% of all 2025 defaults | Moody’s (2026) |
Sources: Hamilton Lane, Morgan Stanley IM, Capstone Partners / PitchBook LCD, Valuation Research Corp, Federal Reserve FRED/SLOOS, FSB, Columbia Threadneedle, Moody’s, StreetStats/ICE BofA, Owners.pe, Avante Capital / NEPC / LSEG LPC, Partners Group. Data as of Q3 2026 or most recent available. All spreads over SOFR unless otherwise noted.
Sector Analysis: Where Capital Is Flowing — and Where It Is Retreating
🟢 Hot Sectors: Healthcare, Business Services, Infrastructure-Adjacent
Healthcare remains the anchor of private credit portfolio construction. Octus data confirms that healthcare led all sectors in 2025 private credit activity, accounting for 19% of all direct lending deals — and critically, it was the only major sector not to experience significant year-over-year pricing compression, with spreads landing at approximately SOFR+500 bps in Q4 2025. Demographic tailwinds, non-cyclical revenue models, and a deep pipeline of sponsored platform transactions continue to underpin lender confidence heading into Q4 2026. However, caution is warranted: healthcare also leads in non-accrual rates among certain BDC managers, reflecting a bifurcation between high-quality platforms and operationally stressed operators.
Business Services has absorbed share from declining Industrials exposure. Credit Benchmark’s review of 20 major U.S. private credit funds finds that Technology, Business Services, and Healthcare remain the most concentrated sector exposures — with Business Services registering a multi-percentage-point year-on-year uptick at the expense of Industrials. Asset-light business models with recurring revenue streams remain the template for lender comfort. PitchBook data confirms that professional and business services accounted for nearly 19% of PE transactions in Q3 2025, reflecting an enduring investor preference for these models.
Infrastructure-adjacent and specialty finance is emerging as a structural growth area. With Intelligence reports that specialty finance was the most popular strategy for new private credit fund launches in the first three quarters of 2025, with 84 launches versus 71 for direct lending. Specialty finance now represents 34% of all funds in development, up from 23% in 2024, with the 10 largest specialty finance funds collectively targeting approximately $35 billion.
🔴 Cold Sectors: Software/SaaS and AI-Disrupted Technology
The most significant structural shift underway is the repricing and underwriting reconstitution of software and SaaS credit. Partners Group identifies the core risk: loans underwritten against Annual Recurring Revenue (ARR) multiples for seat-based B2B SaaS businesses face direct challenge from AI-driven efficiency gains that reduce seat demand and erode the unit economics underpinning those loan structures. As a result, lenders are already shifting from ARR- to EBITDA-based frameworks for software underwriting, and demanding spreads that are up to 150 bps wider than a year ago. Morgan Stanley IM confirms that the pullback in technology underwriting, combined with net BDC outflows, directly contributed to the broader spread widening observed in H1 2026.
The KPI underwriting frameworks for these sectors are also shifting materially. Columbia Threadneedle citing S&P data reports that middle-market deals average only 1.7x–1.8x EBITDA-to-interest coverage — a thin margin of safety relative to historical norms of 2.0x–2.2x. Furthermore, S&P estimates that PIK loans now account for more than 11% of the private credit market, up from roughly 5% in early 2022, with approximately 3%–4% of private credit deals having amended terms mid-stream to add PIK features — a form of shadow restructuring that lenders and investors must scrutinize carefully within Fixed Charge Coverage Ratio (FCCR) analysis.
Strategic & Operational Implications
For Borrowers & Operating Executives
The borrower-friendly environment of 2024–early 2025 is over. Lord Abbett observes that lenders are now demanding fewer PIK requests, less aggressive leverage, more covenants, and stronger documentation — signals that spread widening, when it fully arrives, will be preceded by tightening structural terms. For operating companies seeking new financings or refinancings, the actionable implication is to engage lenders earlier, with fully prepared EBITDA bridge analyses and a defensible forward FCCR case. With middle-market interest coverage averaging only 1.7x–1.8x, any lender-required stress test scenario — adding 100 bps to floating-rate obligations — will scrutinize whether coverage remains above 1.1x–1.2x. Borrowers relying on aggressive EBITDA addbacks to support leverage at 5x–6x face heightened documentation scrutiny, given FSB warnings that headline leverage in private credit may understate true leverage by 1x–2x. Meanwhile, Heron Finance’s Q2 2026 benchmark of 69 U.S. private credit funds provides a reassuring data point: debt/EBITDA ratios and LTVs have remained stable across the fund universe, with no material upward drift — suggesting that aggregate underwriting discipline has held, even as isolated pockets of stress have emerged.
For Institutional Investors & Lenders
The repricing of private credit spreads back to SOFR+500 bps is a materially improved entry point relative to H1 2026 lows. SG Analytics citing Ares documents that across multiple rate cycles, private credit has delivered 200–400 bps of excess return over liquid credit markets — though investors must now weigh this against the compressed premium over public high yield, which has narrowed from ~350 bps in 2019 to approximately 150–200 bps today. The critical consideration: BNY Investments notes that high-yield all-in yields of approximately 7.3%–7.9% — with full daily liquidity, deep secondary markets, and materially lower fees — present a credible competing allocation for investors unwilling to pay the illiquidity premium at compressed spread differentials. Private credit’s structural advantage remains real (floating rate, covenant control, recovery priority), but only for investors with genuine long hold horizons. Wellington Management captures the new mandate precisely: outcomes are increasingly shaped by relative-value assessment, sourcing breadth, underwriting discipline, and access to liquidity tools — not by broad market beta.
BDC-specific liquidity risk also demands active management. McKinsey citing AltsWire data reports that BDC redemption requests reached approximately 16% of NAV in Q1 2026, a level that has forced funds to operate at or near contractual redemption limits. Managers with diversified capital structures, secondary market access tools, and robust LP communication programs will be structurally better positioned than those relying solely on traditional quarterly liquidity mechanisms.
Forward-Looking View: Q4 2026 and Into 2027
Capstone Partners / PitchBook LCD survey data confirms that both lenders and sponsors expect deal flow to increase in Q3 2026 — and that demand for new loans already exceeds current supply, a supply/demand imbalance last seen in 2024–2025 that could compress spreads again if deal flow recovery underdelivers. However, the pipeline looks increasingly credible: PE deal volume projections for full-year 2026 call for approximately 10,000 transactions totaling $1.4 trillion — with AI infrastructure, tech-enabled services, and professional services featuring prominently as financing targets.
The regulatory context has also shifted in ways that may structurally expand the addressable lending universe. The December 2025 rescission of OCC/FDIC Leveraged Lending Guidance gives banks greater flexibility to compete across a broader range of leveraged transactions — a dynamic that could partially re-tighten spreads as bank competition returns in select upper-middle-market credits. Cleary Gottlieb notes, however, that the debt financing market for larger transactions remains highly competitive, so large-cap borrowers will continue to retain meaningful negotiating leverage on terms.
On the macro side, ECM Source highlights that the Federal Reserve’s deferral of rate cut expectations toward 2027 has materially changed the calculus for leveraged borrowers — many of whom loaded up on floating-rate structures during 2020–2022 under the assumption of faster normalization. With the 10-year Treasury at 5.24% as of late September 2026, all-in borrowing costs remain structurally elevated, and the refinancing maturity wall from 2021–2022 vintage transactions presents an active underwriting calendar for direct lenders. Private credit’s core competitive advantage — speed, confidentiality, and flexible structuring without syndication road shows — remains structurally intact and increasingly valued as execution complexity rises in the current environment.
Key Market Insights — Actionable Intelligence
- The spread reset is real, but uneven. Large-cap direct lending spreads have repriced to SOFR+500 bps from mid-400s — a 50–75 bps improvement for lenders. But the lower middle market commands an additional 232 bps premium, presenting a risk-adjusted opportunity for managers with origination infrastructure at the sub-$50M EBITDA borrower level. (Avante Capital / NEPC)
- FCCR and coverage compression are the primary credit risk signal. Middle-market average interest coverage of 1.7x–1.8x leaves minimal room for revenue or EBITDA shortfalls. Any lender underwriting to a FCCR below 1.1x under a 100-bps stress test should be treated as a structural warning signal, particularly for floating-rate debt at current SOFR levels. (Columbia Threadneedle / S&P)
- Software underwriting requires framework reconstitution. ARR-based loan structures for seat-count-dependent SaaS businesses are being actively repriced 100–150 bps wider, and leading lenders are migrating to EBITDA-based frameworks. Companies with AI-resilient, workflow-critical software (not seat-dependent) will continue to attract competitive direct lending terms; others face structural repricing or lender retreat. (Partners Group)
- PIK at 11% of market is a shadow credit quality indicator. The growth of PIK structures to over 11% of the private credit market — and mid-stream PIK amendments affecting 3%–4% of deals — represents a form of deferred credit stress that conventional FCCR and non-accrual metrics do not fully capture. Investors and operators should demand transparent covenant reporting that distinguishes cash-pay from PIK income in coverage calculations. (Columbia Threadneedle / S&P)
- The private credit illiquidity premium is being actively arbitraged. With private credit’s yield premium over public high yield compressed from ~350 bps (2019) to ~150–200 bps today, institutional allocators are increasingly re-evaluating the risk-adjusted case for locking capital in 5–7 year illiquid vehicles. The winning positioning for the next 12 months lies in the middle market (where spread premium over large cap remains robust), in healthcare and business services (where sector fundamentals support underwriting discipline), and in specialty finance strategies (where ABS structures provide relative-value differentiation). (Owners.pe; BNY Investments)


