
Underwriting & Risk Management | Bond Capital
EBITDA Adjustments and Normalization: How Lenders Build, and Defend, Lender-Adjusted EBITDA in Credit Underwriting
The $2.6 Million Problem
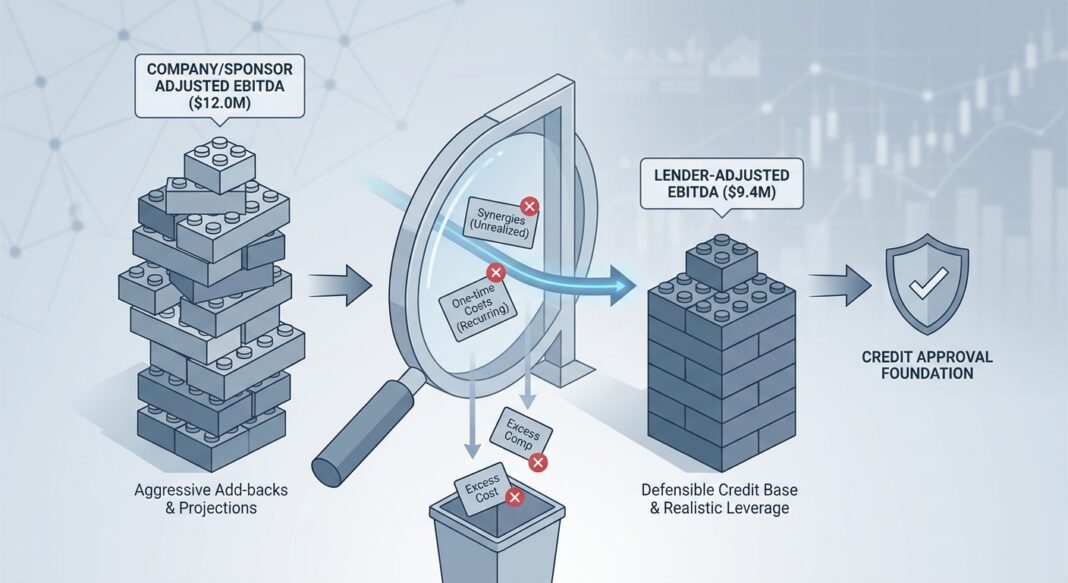
Picture this: A sponsor presents a confidential information memorandum for a $35 million senior secured term loan backing the acquisition of a specialty manufacturer. The cover page headline reads “$12.0M LTM Adjusted EBITDA.” The proposed leverage is 2.9x, comfortable, seemingly conservative. The interest coverage ratio clocks in at a healthy 3.1x. The deal looks fundable.
Then your credit analyst starts pulling at the threads.
After reviewing three years of audited financials, management accounts, and the Quality of Earnings report, the lender’s own normalized EBITDA lands at $9.4 million: a $2.6 million gap from the sponsor’s figure. Suddenly, leverage is 3.7x. Coverage drops to 2.3x. That gap did not come from one bad actor or one fraudulent entry. It came from a cascade of individually defensible-sounding adjustments that, in aggregate, painted an earnings picture far more flattering than the business could actually sustain under new ownership.
This scenario plays out across the middle market every week. As the credit cycle matures, the discipline of EBITDA normalization has never been more consequential, or more contested. Understanding how to build, challenge, and anchor a Lender-Adjusted EBITDA figure is among the highest-value skills in the credit analyst’s toolkit.
The Three-Layer EBITDA Framework
Experienced lenders do not work from a single EBITDA number. They work across three distinct layers, each serving a different underwriting function:
| Layer | Definition | Who Produces It | Underwriting Use |
|---|---|---|---|
| Reported EBITDA | Net income + interest + taxes + D&A, directly from audited statements | Company / Auditors | Baseline; starting point only |
| Company-Adjusted EBITDA | Reported EBITDA plus management’s proposed add-backs | Management / Sponsor | Inputs for negotiation; treated with professional skepticism |
| Lender-Adjusted EBITDA | The figure the credit officer independently underwrites after accepting, rejecting, or haircut-ting each adjustment | Credit Analyst / Lender | Governs leverage ratio, covenant headroom, and credit approval |
This distinction matters because, as Crediflow’s credit analysis framework notes, “lender-adjusted EBITDA reflects what the underwriter accepts after review”, and that number can diverge materially from the company-adjusted figure. The objective of the normalization exercise is not to maximize earnings. It is to measure the borrower’s realistic ability to service debt under a representative operating base.
A fourth construct, Covenant-Defined EBITDA, also matters. This is the definition negotiated into the credit agreement itself, which may permit certain add-backs that a conservative credit officer would reject for underwriting purposes. Lenders must understand that the covenant EBITDA definition and the underwritten EBITDA figure are not always the same number, and that difference represents embedded structural risk.
The Measurement Period: LTM vs. Run-Rate
Before adjusting a single line item, lenders must anchor the measurement period. LTM (Last Twelve Months) EBITDA uses the trailing twelve-month window, typically ending at the most recent quarter-end. Run-rate EBITDA projects a current revenue or cost structure annualized forward. The two can diverge significantly in businesses with strong recent revenue momentum, recent cost eliminations, or seasonality. Credit analysts should always underwrite the lower of a defensible LTM and a conservatively modeled run-rate, not the higher, until corroborating evidence supports the uplift.
Walking the Bridge: A $10M EBITDA Manufacturing Company
Consider a specialty industrial company with LTM revenue of $48 million and reported net income of $2.1 million. The sponsor’s Adjusted EBITDA bridge presents as follows:
| Item | Sponsor Add-Back ($000s) | Lender Decision | Lender Credit ($000s) | Rationale |
|---|---|---|---|---|
| Net Income | $2,100 | – | $2,100 | Starting point |
| Interest Expense | $1,800 | Accept | $1,800 | Standard; verifiable |
| Taxes | $620 | Accept | $620 | Standard |
| D&A | $1,480 | Accept | $1,480 | Verified against fixed asset schedule |
| Reported EBITDA | $6,000 | – | $6,000 | – |
| Owner Excess Compensation | $850 | Haircut to $400 | $400 | Market replacement salary benchmarked at $450K vs. owner’s $850K draw; partial credit only |
| One-Time Legal Settlement | $620 | Partial, $300 | $300 | Matter partially unresolved; ongoing litigation risk; conservatively haircut |
| Facility Consolidation Costs | $750 | Reject | $0 | Restructuring not yet complete; savings not in run-rate; forward-looking |
| Stock-Based Compensation (SBC) | $480 | Reject | $0 | SBC is a recurring economic cost; market practice has tightened against SBC add-backs since 2025 |
| COVID-Era Insurance Recovery (2022) | $300 | Reject | $0 | Non-recurring; not a forward operating cost |
| Related-Party Rent Normalization | $440 | Accept with caveat | $440 | Lease assigned at market rates post-closing; confirmed via third-party appraisal |
| Sponsor-Adjusted EBITDA | $9,440 | – | – | – |
| Lender-Adjusted EBITDA | – | – | $7,140 | – |
With a proposed $35M loan and sponsor-adjusted EBITDA of $9.44M, leverage appeared to be 3.7x. On the lender’s $7.14M figure, leverage is 4.9x: a materially different risk profile, and one that would trigger closer scrutiny under most institutional lending policies. Interest coverage on the lender figure drops to approximately 1.9x at current floating rates, uncomfortably close to a 1.75x minimum covenant threshold.
This single exercise, rebuilding the EBITDA bridge from scratch, may be the most valuable 40 hours a credit analyst spends on any transaction.
What the Market Data Says: EBITDA Risk in a Stressed Credit Cycle
The stakes of EBITDA underwriting discipline have risen sharply as the credit cycle has turned. The following data points from institutional sources frame the risk environment as of mid-2026:
📊 Credit Performance Data Box: Mid-2026
- Private Credit Default Rate (2025): Moody’s estimates the 2025 private credit default rate ranged from 1.6% to 4.7%, depending on whether distressed exchanges are included, with distressed restructurings accounting for approximately 65% of all defaults that year. (Source: Moody’s Ratings, April 2026)
- Proskauer Private Credit Default Index (Q2 2026): Recorded a 2.51% default rate across 716 loans representing $195.6 billion in senior secured and unitranche credit. (Source: Proskauer via Investing.com, 2026)
- Fitch, Broader Definition: Applying a broader default definition, Fitch reported the U.S. private credit default rate reaching a record 6.0% in April 2026. (Source: Fitch Ratings via Investing.com, 2026)
- Cliffwater CDLI Credit Losses: Despite headline default noise, the Cliffwater Direct Lending Index reported annualized credit losses of approximately 0.75% for senior secured middle market loans as of Q2 2025, reflecting the benefit of structural seniority and collateral. (Source: Cliffwater / Larry Swedroe, August 2025)
- Leverage Creep: An analysis by Secured Research via ABF Journal found that the middle market credit estimate population hit 7x leverage in 2024, with approximately 20% of companies below 1.0x EBITDA interest coverage: a direct consequence of aggressive add-back acceptance. (Source: ABF Journal, June 2025)
- Typical Direct Lending Structure: A typical direct lending transaction as of 2026 carries maximum leverage covenants around 4.0x EBITDA and minimum interest coverage near 2.5x. (Source: Investing.com Private Credit Outlook, 2026)
- CDLI Since Inception: The Cliffwater Direct Lending Index has delivered an annualized total return of 9.46% since inception, tracking ~23,000 directly originated middle market loans totaling $553 billion. (Source: Cliffwater, September 2026)
The SBC and Synergy Add-Back Shift
Market practice has shifted meaningfully since the low-rate era. Two changes are especially relevant to EBITDA underwriting:
1. Stock-Based Compensation Add-Backs Are Under Pressure. Sponsor LOIs in the lower middle market in 2026 now routinely exclude all SBC add-backs, a practice that was standard in 2021. The market has adopted a more conservative posture, recognizing SBC as a recurring economic cost that should not be excluded from a borrower’s cost structure.
2. Synergy Add-Backs Now Require Realization Timelines. Sponsor purchase agreements increasingly permit pro forma synergies in covenant calculations only if they are realized within 18 months of closing, with documentation reviewed by an independent accounting firm, introducing welcome discipline to what was previously a loosely documented category.
Additionally, because expansive add-backs can materially affect leverage outcomes, lenders increasingly impose caps (including shared percentage-of-EBITDA caps on certain projection-based or non-recurring adjustments) to limit the cumulative impact of any add-back basket on the reported leverage ratio.
The Covenant Definition Gap
One of the most consequential (and underappreciated) risks in private credit is the divergence between underwritten EBITDA and covenant-defined EBITDA. A credit agreement that permits broad add-backs can allow a borrower to show technical covenant compliance even as the underlying business deteriorates. The negotiation of the EBITDA definition in a cash flow-based credit facility is, in the words of Lexology’s Adjusted EBITDA Cheat Sheet, “fundamental to the size of the default risk of the applicable loan.” Lenders who accept permissive covenant EBITDA definitions to win deals may find they have signed away their early warning system.
Red Flags: What Aggressive EBITDA Looks Like in Practice
Experienced credit officers recognize patterns. The following are the most common signals of an over-adjusted EBITDA presentation:
- 🚩 Add-backs exceed 20–25% of reported EBITDA. At this level, the adjustments are no longer clarifying; they are constructing an alternative reality. Scrutinize every line.
- 🚩 Recurring items relabeled as “one-time.” If restructuring charges, integration costs, or consulting fees appear in the same category for three consecutive years, they are recurring. Lenders should strip them.
- 🚩 Cost savings that depend on post-closing actions. Anticipated savings from headcount reductions, facility closures, or vendor renegotiations that have not yet been executed should receive zero credit in underwritten EBITDA. The business should be credited only for earnings and improvements it can support before closing.
- 🚩 Owner compensation normalized without market benchmarking. The excess-compensation add-back is legitimate only when the delta between the owner’s compensation and the market replacement cost is both documented and defensible. A replacement CEO at $500K does not justify adding back $1.2M in owner draw.
- 🚩 Run-rate revenue with limited invoice history. Implemented price increases or new customer ramps should receive credit only when invoices, shipping records, and retention data confirm the revenue is already in the run rate, not merely contracted or forecast.
- 🚩 The QoE and the CIM tell different stories. Divergence between management’s EBITDA bridge and what the Quality of Earnings firm independently identifies is a diligence failure signal. If the sponsor’s QoE firm has accepted adjustments that a careful read of the footnotes would not support, that demands explanation.
The EBITDA Normalization Underwriting Checklist
Use this framework as a repeatable process for every sponsored transaction or direct origination requiring cash flow-based underwriting:
-
Anchor the Measurement Period
- Confirm LTM end date; tie to most recent audited or reviewed period
- Identify any stub periods, acquisitions, or divestitures requiring pro forma treatment
- Flag any material seasonality that distorts the trailing period
-
Reconstruct Reported EBITDA Independently
- Pull directly from audited P&L; do not start from management’s bridge
- Confirm D&A from fixed asset schedule, not summary disclosure
- Verify interest expense ties to debt schedule and rate confirmations
-
Categorize Every Add-Back Individually
- Non-recurring vs. recurring (minimum 3-year look-back required)
- Cash vs. non-cash (non-cash add-backs, including SBC, receive heightened scrutiny)
- Realized vs. projected (only give credit to changes already in the run-rate)
- Owner/related-party economics (benchmark all compensation to market; adjust both up and down)
-
Apply Documentation Standards
- Request supporting documentation: invoices, board minutes, engagement letters, severance agreements
- For any add-back exceeding $250K, require third-party corroboration or QoE firm support
- Related-party rent adjustments require independent appraisal at market rate
-
Build the Lender-Adjusted EBITDA Bridge
- Accept, haircut, or reject each item with a written rationale
- Cap total add-backs as a percentage of reported EBITDA (common practice: 15–20% internal policy cap)
- Document the delta between sponsor-adjusted and lender-adjusted EBITDA
-
Calculate Key Credit Metrics on Lender-Adjusted EBITDA
- Total Debt / Lender-Adjusted EBITDA (leverage ratio)
- Lender-Adjusted EBITDA / Cash Interest Expense (coverage ratio)
- Lender-Adjusted EBITDA minus CapEx / Cash Interest Expense (fixed charge coverage, FCCR)
- Free Cash Flow Conversion: (Lender EBITDA − Tax − CapEx − Working Capital Change) / Lender EBITDA
-
Stress Test the Lender-Adjusted Figure
- Downside Case: Apply a 15–20% EBITDA haircut and model covenant compliance
- Sensitivity: At what EBITDA level does the borrower breach the leverage covenant? The coverage covenant?
- Identify the "covenant cushion": the dollar amount of EBITDA deterioration the borrower can absorb before breach
-
Review Covenant EBITDA Definition Against Underwritten Figure
- Flag any add-back baskets in the proposed credit agreement that exceed your underwritten figure
- Assess whether the covenant definition provides genuine early warning or masks deterioration
- Negotiate caps on projection-based add-backs (e.g., synergy realization within 18 months)
Key Takeaways for Credit Analysts
- 🔑 There are three EBITDA numbers that matter: Reported, Company-Adjusted, and Lender-Adjusted. Only the last one governs your underwriting decision, rebuild it yourself, every time.
- 🔑 The add-back gap is a leverage gap. A $2.6M difference in EBITDA on a $35M loan is not a rounding error; it can move leverage by 80–100 basis points and change the risk profile of an entire credit facility.
- 🔑 Market practice has tightened, and for good reason. SBC add-backs are no longer standard; synergy credits require documented realization timelines; and the 2025–2026 default cycle has validated conservative normalization as loss mitigation, not just conservatism.
- 🔑 The covenant EBITDA definition is a risk document. Lenders who accept permissive add-back baskets in the credit agreement surrender early warning signals. The gap between underwritten EBITDA and covenant-defined EBITDA is latent covenant optionality for the borrower, at the lender’s expense.
- 🔑 Documentation is not paperwork; it is the underwrite. Every accepted add-back above a materiality threshold must be documented with third-party corroboration. Unsupported add-backs accepted during diligence become indefensible during workout.


