
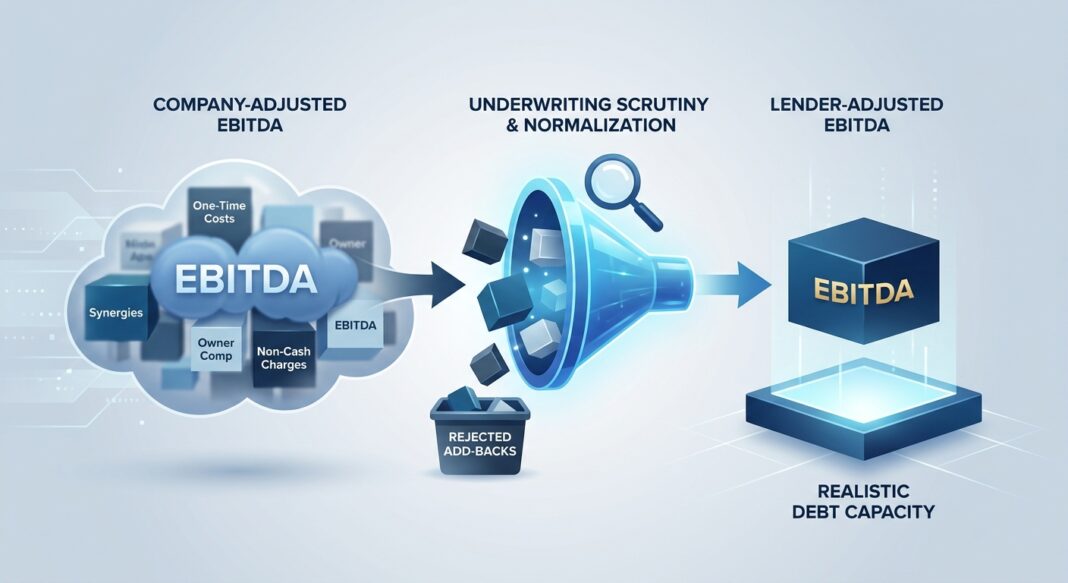
The Underwriting Challenge: When Adjusted EBITDA Becomes a Risk
Imagine a sponsor presents a $10M EBITDA manufacturing business and requests $50M in first-lien debt, a clean 5.0x leverage multiple. The Confidential Information Memorandum lists 14 add-backs totaling $3.2M, transforming $6.8M of reported earnings into the headline $10M figure. Your credit committee needs an answer: is that $10M real?
This is the central challenge of EBITDA normalization in private credit underwriting. Every add-back is an assertion: a claim that a cost was non-recurring, non-operational, or owner-specific, and therefore should not penalize the borrower’s debt capacity. The problem is that management and sponsors have every incentive to maximize that figure. As one practitioner framework puts it: the point of EBITDA adjustments in credit analysis is not to maximize earnings; it is to measure the borrower’s ability to service debt under a realistic operating base.
Getting this wrong has direct consequences. An inflated EBITDA base understates true leverage, sets covenant headroom too wide, and masks deterioration until it is too late. With private credit default rates rising sharply in 2025 and 2026, this analytical discipline is not academic; it is the difference between a performing loan and a workout.
The Framework: Three Layers of EBITDA, and Why Lenders Must Own the Third
Experienced credit officers recognize that EBITDA is not a single number. It exists in at least three distinct versions, each with different implications for underwriting:
- Reported EBITDA: Derived directly from audited or reviewed financial statements. Net income plus interest, taxes, depreciation, and amortization. This is the floor.
- Company-Adjusted (or Sponsor-Adjusted) EBITDA: Management’s proposed version, incorporating add-backs for one-time costs, owner compensation normalization, run-rate synergies, and non-cash charges. This is the ceiling, and often an aggressive one.
- Lender-Adjusted EBITDA: The underwriter’s independently constructed figure, accepting only those adjustments that survive rigorous scrutiny. This is what governs the credit decision.
There is a fourth definition that often diverges from all three: Covenant-Defined EBITDA, which follows the specific formula negotiated into the credit agreement. As Sidley Austin notes in its June 2026 analysis of private credit documentation, this definition governs leverage ratios, pricing grids, and permission baskets for the entire life of the loan, and it may differ materially from what the credit officer used in underwriting.
Example, Analyzing a $10M EBITDA Manufacturing Company:
A sponsor presents the following EBITDA bridge for a precision metals manufacturer seeking $48M in first-lien financing:
| Item | Amount | Lender Verdict |
|---|---|---|
| Reported EBITDA (LTM) | $6,800,000 | Accepted |
| Owner compensation normalization (+$420K market rate delta) | $420,000 | Accepted with documentation |
| One-time legal settlement (fully documented, non-recurring) | $380,000 | Accepted |
| Plant relocation costs (Q2 only, fully expensed) | $290,000 | Accepted with haircut to $210K |
| Run-rate cost savings from ERP implementation (not yet realized) | $800,000 | Rejected, no realization evidence |
| Stock-based compensation add-back (recurring in nature) | $180,000 | Rejected, recurring item |
| Pro forma synergies from bolt-on acquisition | $630,000 | Haircut to $315K, subject to 12-month cap |
Lender-Adjusted EBITDA: $8,205,000 vs. Sponsor-Adjusted EBITDA: $10,500,000
The leverage multiple shifts from 4.6x (sponsor view) to 5.9x (lender view) on the same $48M debt quantum. That single analytical step changes the credit decision entirely.
The Analysis: Walking Through Adjustments and Identifying Stress Points
Once the lender-adjusted EBITDA is established, the underwriter must apply it across three core credit metrics:
- Total Leverage Ratio: Total Debt ÷ Lender-Adjusted EBITDA. In the current market, senior-debt-to-LTM-EBITDA caps for middle market transactions typically sit between 4.0x and 6.0x, with total debt including subordinated layers reaching 5.5x to 7.5x.
- Interest Coverage Ratio (ICR): Lender-Adjusted EBITDA ÷ Total Cash Interest Expense. A typical direct lending transaction carries a minimum interest coverage covenant near 2.5x. S&P data shows that speculative-grade EBITDA interest coverage stabilized near 2.3x through late 2024, but for CCC/CC-rated borrowers, coverage remains strained at below 1.0x.
- Fixed Charge Coverage Ratio (FCCR): (EBITDA − CapEx − Taxes) ÷ (Interest + Required Principal). This is the debt service reality check. Lenders should require FCCR of at least 1.15x–1.25x at close, with covenant step-downs modeled forward.
Stress Testing the Manufacturing Example:
Using Lender-Adjusted EBITDA of $8.2M, $48M of debt at SOFR + 500bps (assume 10.3% all-in at current rates), and $1.5M in annual amortization:
- Cash interest: ~$4.9M | Coverage: 1.67x, within covenant but thin
- FCCR (assuming $1.2M CapEx, $400K taxes): ($8.2M − $1.2M − $0.4M) ÷ ($4.9M + $1.5M) = 1.03x, a covenant breach signal under stress
- Downside case (15% EBITDA compression to $6.97M): FCCR falls to 0.70x, structural default territory
This scenario underscores why add-back discipline matters upstream: an inflated EBITDA base creates false covenant headroom that evaporates precisely when the business faces operating stress, the moment lender protection is most needed.
Lenders should also apply the CARVE Test to each adjustment: Is it Cash-impact verified? Auditable via source documents? Recurring or genuinely one-time? Verifiable through third-party evidence? Excluded from ongoing operations? Any adjustment that fails two or more of these criteria should be rejected or heavily discounted.
Industry Standards: What the Data Says About Add-Back Risk and Credit Performance
The market has tightened its posture on EBITDA adjustments, and credit performance data explains why.
Default & Recovery Rate Context (2025–2026)
📊 Key Credit Performance Data
- Private credit default rate (2025): Moody’s estimates a range of 1.6% to 4.7% depending on whether distressed exchanges are included, with distressed restructurings accounting for approximately 65% of all 2025 defaults. (Source: Moody’s, April 2026)
- Fitch record high: Fitch Ratings reported the U.S. private credit default rate reached a record 6.0% in April 2026, with private-credit-backed corporate borrowers experiencing a 9.2% default rate in 2025. (Source: Fitch, via Forbes, May 2026)
- Proskauer Default Index: Proskauer’s Private Credit Default Index, tracking 697 loans totaling $189.2 billion, recorded a 2.73% default rate in Q1 2026, up from 1.84% just two quarters earlier. (Source: Proskauer, via Forbes, May 2026)
- Senior secured recovery rates: According to Moody’s historical recovery rate data, senior secured loans have consistently recovered 60% or more of face value in default scenarios, compared to roughly 40–50% for senior unsecured debt. S&P notes first-lien recovery ratings have declined to the mid-to-low 60% area over the past six years, down from long-term averages of 75%–80%, driven by increasing leverage and shrinking junior debt cushions. (Source: S&P Global Ratings, February 2025)
- Cliffwater CDLI-S realized losses: The Cliffwater Direct Lending Index – Senior posted an annualized realized loss rate of just 0.29% from September 2010 through September 2025, compared to 1.49% for high-yield bonds over the same period. (Source: Cliffwater, via Dechert, May 2026)
- Covenant-lite expansion: Covenant-lite structures grew from 4% to 21% of private credit deals between 2023 and 2025, with caps on EBITDA add-backs also disappearing across documentation. (Source: SSRN/Coney, June 2026)
What Institutional Lenders Require
Experienced direct lenders impose structural guardrails on EBITDA definitions that borrowers and sponsors routinely resist. Best practice documentation includes: add-back caps (typically expressed as a percentage of EBITDA, such as a 25% aggregate limit on non-cash and run-rate items); time-based restrictions on pro forma synergies (12–18 months maximum realization window); and dual EBITDA presentation requirements for sectors with recurring stock-based compensation, such as software and SaaS.
Credit committees increasingly flag deals where add-back composition exceeds 25% of total EBITDA in run-rate savings and non-cash items, treating that concentration as a standalone credit risk factor, not simply a documentation issue.
Common Red Flags in EBITDA Submissions
- Relabeled recurring costs as one-time: Compliance remediation, customer churn losses, and IT maintenance appearing as “extraordinary” items year after year.
- Unrealized synergies treated as realized: Cost savings attributed to headcount reductions or vendor renegotiations that have not closed.
- Owner compensation understated: Below-market founder salaries inflating EBITDA; QoE teams reverse this by modeling market replacement cost.
- Calendar-year EBITDA in a mid-year sale: Sponsors presenting full prior-year figures that miss recent deterioration. Always underwrite to trailing twelve months (TTM/LTM) ending at the most recent quarter.
- PIK interest masking cash stress: Rising payment-in-kind income at the portfolio level is an established early-warning signal of borrower cash flow deterioration.
Underwriting Checklist: EBITDA Normalization Due Diligence
Use this framework on every credit submission involving adjusted EBITDA:
✅ Documentation Requirements
- Three years of audited (or CPA-reviewed) financial statements plus LTM stub period
- Management-prepared EBITDA bridge with line-item support for every adjustment
- Quality of Earnings (QoE) report from an independent accounting firm (required for transactions over $15M)
- Source documents for each add-back: invoices, legal settlement agreements, severance records, board resolutions
- Copies of all employment and compensation agreements (owner/founder compensation normalization)
✅ Analytical Questions to Ask
- Can this adjustment be traced to a specific, dated document? (Auditability)
- Has this cost appeared in prior periods under any label? (Recurrence test)
- Would a new owner operating the business at arm’s length incur this cost? (Sustainability test)
- What percentage of total EBITDA do unverified run-rate and non-cash add-backs represent? (If >25%, require independent validation or haircut.)
- Are pro forma synergies contractually committed or hypothetical? (For uncommitted synergies, apply a minimum 50% haircut and cap at 12 months.)
- What does LTM EBITDA look like with zero add-backs? Does the debt still make sense?
✅ Covenant Structuring Checklist
- Define Covenant EBITDA separately from underwriting EBITDA, be more conservative in the agreement
- Cap aggregate add-backs at 25% of base EBITDA in the credit agreement
- Build quarterly maintenance covenant tests (leverage and coverage), not just incurrence tests
- Require post-close monthly reporting with realized vs. projected add-back tracking
- Set covenant step-downs tied to add-back realization milestones (if synergies not realized within 9 months, covenant resets to lower headroom)
Key Takeaways
- 🔍 Never accept management’s EBITDA at face value. Lender-adjusted EBITDA, independently reconstructed by the underwriting team, must be the basis for leverage, coverage, and covenant calculations. A $500K reduction in unsupported add-backs on a $2.4M EBITDA can shift effective leverage from 3.5x to 4.4x.
- 🚫 Add-back concentration is a standalone credit risk. When more than 25% of EBITDA derives from run-rate savings and non-cash items, require independent validation or haircut the underwriting base. Credit committees should treat add-back composition as a deal-level risk indicator.
- 📈 Covenant EBITDA and underwriting EBITDA should not be the same number. The credit agreement definition should be more conservative: caps, time windows, and documentation standards must be locked into the agreement, not left to post-close interpretation.
- ⚠️ Rising distressed restructurings signal that add-back optimism has consequences. With distressed exchanges representing approximately 65% of 2025 private credit defaults, and Proskauer’s Default Index rising three consecutive quarters through Q1 2026, the market is repricing the cost of inadequate underwriting discipline.
- 🛡️ Senior secured positioning is necessary but not sufficient. While the Cliffwater CDLI-S shows a 0.29% annualized loss rate for senior direct loans, S&P notes first-lien recovery rates have declined to the mid-to-low 60% area due to higher leverage and shrinking junior debt cushions. Structural seniority must be backed by rigorous EBITDA underwriting, not assumed to compensate for it.


