
Underwriting & Risk Management | Credit Analysis
EBITDA Adjustments and Normalization: A Credit Underwriter's Field Guide to Separating Real Earnings from Financial Engineering
The Underwriting Challenge: What Is the Borrower Actually Earning?
A sponsor-backed manufacturing company presents a Confidential Information Memorandum showing $12.4M in Adjusted EBITDA. The ask is $62M in senior secured debt, a 5.0x leverage multiple that clears most institutional thresholds on paper. The seller's add-back schedule is seven pages long. It includes $1.8M in “non-recurring” legal expenses, $940K in management bonuses flagged as above-market, $620K in COVID-related costs still being added back in 2026, and $1.2M in “run-rate” cost savings from a headcount reduction that was announced but not fully executed at the time of closing.
Strip the questionable add-backs and the real EBITDA may be closer to $9.1M: implying true leverage of nearly 6.8x. At that entry point, with floating-rate debt at SOFR + 500 bps, debt service coverage erodes quickly in any revenue stress scenario. The deal that appeared to have 20% covenant headroom has almost none.
This is not a hypothetical edge case. It is the central credit underwriting challenge of the current private credit cycle. As the market has matured and sponsors have grown sophisticated, the bridge between reported GAAP earnings and Adjusted EBITDA has become a primary battleground for credit risk. The lender's job is not to accept the seller's narrative; it is to reconstruct what the business actually earns, in a steady state, under new ownership, as a standalone entity. Everything else is noise.
The Analytical Framework: A Four-Layer Normalization Stack
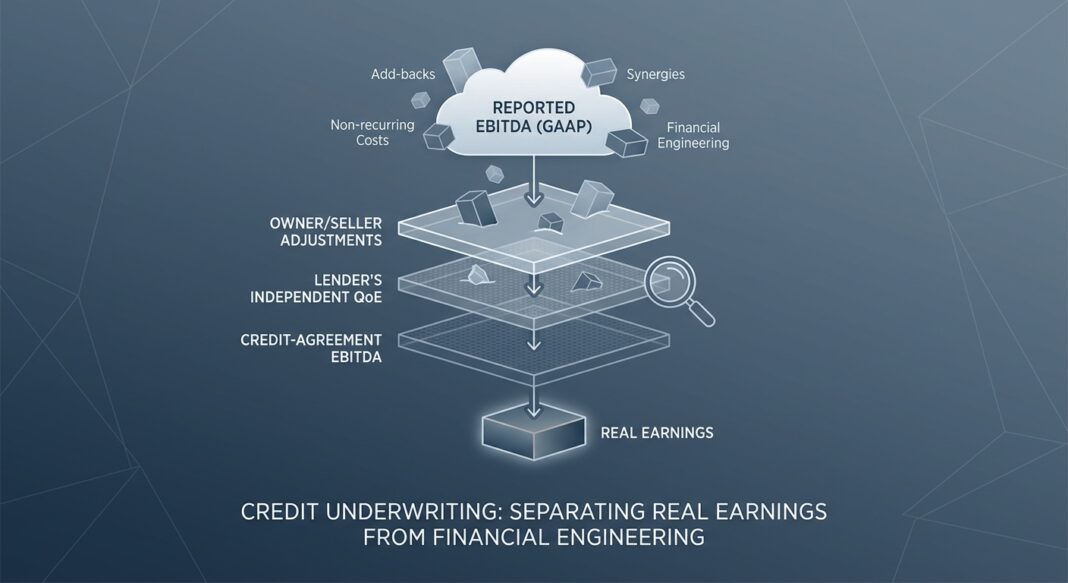
Professional credit underwriting treats EBITDA normalization as a four-layer process, each with a distinct analytical purpose and a different risk profile. The goal is to arrive at a Credit-Agreement EBITDA: the definition that will govern covenant compliance for the life of the loan; that reflects sustainable, recurring operating cash generation and nothing more.
Layer 1: Reported EBITDA (GAAP Starting Point)
Begin with audited financials. Calculate EBITDA from the bottom up: Net Income + Interest Expense + Income Taxes + Depreciation & Amortization. Use a trailing twelve months (TTM/LTM) period, not a calendar year that may be stale. For a business with seasonality or recent acquisition activity, build a monthly roll-forward and restate for the TTM period ending on the most recent available month.
Example, $10M EBITDA Manufacturing Company: Net Income of $3.1M + Interest of $1.4M + Taxes of $820K + D&A of $4.68M = $10.0M Reported EBITDA. This is your baseline. Every adjustment made from here must be documented, defensible, and independently verifiable.
Layer 2: Owner/Seller Adjustments (High Scrutiny Required)
These are the adjustments the borrower presents in their CIM or QoE report. They fall into three defensibility tiers:
- Green (accept with documentation): Excess owner compensation above verified market salary, one-time transaction costs with invoices, true non-recurring litigation with final settlement documents.
- Yellow (negotiate and haircut): Run-rate cost saves with partial execution, synergies from integrations in progress, above-market facility rent adjustments.
- Red (reject or require independent validation): Revenue add-backs for unsigned contracts, COVID-era EBITDAC adjustments, phantom headcount reductions not yet executed, unrealized synergies from future deals.
Layer 3: Lender's Independent QoE Adjustments (Downward)
A rigorous underwriter does not simply accept the seller's add-back schedule as the starting point for covenant setting. The lender's own analysis, often supported by a third-party Quality of Earnings report, adds negative adjustments the seller omitted: normalized capital expenditure requirements, market-rate management replacement costs, recurrence of items labeled one-time, and working capital normalization charges.
Layer 4: Credit-Agreement EBITDA (The Governing Definition)
The final EBITDA definition is negotiated into the credit agreement and governs all leverage and coverage covenant calculations for the duration of the loan. This definition is almost always more conservative than the QoE-adjusted figure used to price the deal. The gap between the two is a key underwriting risk: a borrower priced at 5.0x on QoE EBITDA may enter the credit agreement already at 5.5x on covenant EBITDA, with far less headroom before a default event.
The Analysis: Walking the Bridge from $12.4M to $9.1M
Return to the manufacturing company. Here is how a rigorous underwriter audits each add-back:
| Add-Back Item | Seller Claim | Underwriter Assessment | Credit Given |
|---|---|---|---|
| Reported EBITDA (GAAP) | $10.0M | Confirmed via audit | $10.0M |
| Non-recurring legal costs | +$1.8M | $1.1M confirmed one-time; $700K recurring litigation pattern (3 years) | +$1.1M |
| Above-market owner compensation | +$940K | Market replacement cost validated at $280K differential; balance is operating cost | +$280K |
| COVID-era costs (still being added) | +$620K | Rejected, no longer eligible in 2026; supply chain costs are normalized | $0 |
| Run-rate cost savings (partial execution) | +$1.2M | Only 40% executed at close; 60% haircut applied pending realization within 9 months | +$480K |
| Underwriter's Credit-Agreement EBITDA | $14.56M (seller) | – | $11.86M |
After the lender's independent QoE also identifies $800K in understated maintenance capex and $960K in normalized working capital charges omitted from the seller's schedule, Credit-Agreement EBITDA settles at approximately $10.1M: nearly $2.3M below what the sponsor modeled into the debt capacity calculation.
Stress Test: At $10.1M covenant EBITDA with $62M in debt, entry leverage is 6.1x. Apply a 15% revenue stress (modest for a cyclical manufacturer) and assume a 200bps EBITDA margin compression: EBITDA falls to ~$7.8M, leverage rises to ~7.9x, and the interest coverage ratio drops to approximately 1.5x, near or below most institutional minimum thresholds of 2.0x. The deal requires repricing or a reduced hold size.
Industry Standards: What the Data Says About Add-Back Risk
EBITDA normalization is not an abstract academic concern; it is directly tied to the default and recovery outcomes now materializing across the private credit market. The following data points should anchor every credit committee discussion about add-back aggressiveness.
📊 Credit Performance Data Box
- Private Credit Default Rate (2025): Moody's estimated the private credit default rate ranged between 1.6% and 4.7% in 2025, depending on whether distressed exchanges are included, reflecting a materially wider band of uncertainty than public credit markets typically present. (Source: Moody's, April 2026)
- Distressed Restructurings as % of Defaults: Distressed restructurings (debt exchanges and maturity extensions agreed under duress) accounted for roughly 65% of all 2025 private credit defaults, meaning most “defaults” were soft credit events that defer rather than resolve underlying stress. (Source: Moody's via Forbes, May 2026)
- Record Default Rate (2026): Fitch Ratings reported the U.S. private credit default rate hit a record 6.0% in April 2026, applying a broader definition that captures payment stress before formal default. (Source: Investing.com / Fitch, August 2026)
- Proskauer Private Credit Default Index (Q2 2026): Tracking 716 loans representing $195.6 billion, Proskauer recorded a 2.51% default rate in Q2 2026 across senior secured and unitranche loans. (Source: Proskauer via Investing.com)
- First-Lien Recovery Rates (Declining): Moody's has estimated expected ultimate recoveries on U.S. first-lien loans at roughly 68%, versus long-run historical experience in the high 70s, driven by loan-only capital structures with little junior debt beneath them to absorb losses. (Source: Moody's Ultimate Recovery Database via CLO Data, 2026)
- EBITDA Dispute Rate Post-Closing: The 2025 SRS Acquiom Buy-Side Representations & Warranties Insurance Claims Study found that 18% of post-closing M&A disputes trace to disagreements over EBITDA adjustment definitions in the purchase agreement, making it the leading category of transactional litigation. (Source: SRS Acquiom 2025 via Ledgerism)
- Typical Direct Lending Covenant Structure: A standard direct lending transaction carries maximum leverage covenants around 4.0x EBITDA and minimum interest coverage near 2.5x: parameters that depend entirely on the integrity of the underlying EBITDA definition. (Source: Investing.com Private Credit Market Review, 2026)
What Institutional Lenders Look For in 2026
The credit environment has shifted decisively toward conservatism. Senior debt covenants tightened through 2025 as the credit cycle matured, which forced sponsors to underwrite tighter Adjusted EBITDA definitions. In the lower middle market, sponsor LOIs in 2026 routinely exclude all stock-based compensation add-backs, a category that was standard in 2021. The market has moved to a more conservative posture.
Institutional credit committees now flag deals where a high percentage of EBITDA comes from run-rate or non-cash add-backs, treating that dependence as credit risk rather than financial engineering. The practical threshold that triggers heightened scrutiny: if more than 25% of EBITDA comprises run-rate savings and non-cash add-backs, lenders require independent validation and tighter add-back caps, or apply a haircut to underwriting EBITDA for covenant setting purposes.
A second structural shift in 2026: pro forma synergy add-backs are increasingly permitted in covenant calculations only if realized within 18 months of closing, with documentation reviewed by an independent accounting firm, eliminating the speculative “hand-wave” synergy that defined the 2020–2022 vintage.
The EBITDA Normalization Underwriting Checklist
Use this framework on every new credit origination where EBITDA adjustments exceed 10% of reported earnings.
- Anchor to Audited Financials. Require three years of audited financial statements plus a current-period management stub. Refuse to underwrite from unaudited or management-prepared financials alone. Cross-reference the P&L to tax returns for any discrepancies in owner distributions or related-party transactions.
- Build the Add-Back Schedule Independently. Do not accept the seller's add-back schedule as a starting point for your own model. Have your analyst reconstruct the bridge from GAAP net income to Adjusted EBITDA using source documents only: invoices, board resolutions, severance agreements, third-party compensation benchmarks. Each item must have a document, a rationale, and a defensibility rating.
- Commission or Review a Third-Party Quality of Earnings Report. For any transaction above $5M in EBITDA, a QoE from a recognized accounting firm is non-negotiable. Pay close attention to the QoE's revenue quality analysis, working capital normalization, and any restatements of prior-period earnings. The QoE firm's EBITDA figure is your ceiling, not your target.
- Apply Sector-Specific Recurring-Cost Tests. Healthcare businesses routinely present provider taxes, bad-debt provisions, and compliance costs as non-recurring; they are not. Software and SaaS companies add back stock-based compensation as non-cash, many institutional lenders cap SBC add-backs entirely or require dual EBITDA presentation showing results with and without SBC.
- Stress Test DSCR at the Credit-Agreement EBITDA Level. Build three scenarios: (a) Base Case at 100% of Credit-Agreement EBITDA; (b) Stress Case at 80%; (c) Downside Case at 65%. Calculate Debt/EBITDA, Interest Coverage, and Fixed Charge Coverage Ratio at each scenario. Confirm that the Stress Case stays within covenant thresholds and that the Downside Case does not trigger a payment default.
- Define the Covenant EBITDA with Add-Back Caps. Negotiate a specific cap on total EBITDA add-backs, a common institutional standard is 40% of non-adjusted EBITDA as the ceiling for non-cash and run-rate adjustments. Any add-backs above that cap require independent verification and a step-down schedule tied to realization milestones.
- Establish Post-Close Monitoring Triggers. Covenant definitions are only as strong as the monitoring program behind them. Require monthly management reports showing realized versus planned run-rate savings. If over 50% of run-rate savings are not realized within nine months post-close, mandate updated financial plans and initiate covenant reset discussions before a technical default materializes.
Documentation Requirements
- Three years of audited financial statements (CPA-audited, not reviewed or compiled)
- Most recent twelve-month P&L with monthly detail
- Seller-prepared add-back schedule with line-item source documentation
- Independent QoE report from a nationally recognized accounting firm
- Management compensation benchmarking (BLS, Robert Half, or sector-specific survey)
- Support for all “one-time” charges: signed settlement agreements, final invoices, board minutes
- Documentation for any run-rate savings: executed severance agreements, vendor termination notices, signed contracts
- Customer concentration analysis covering top-10 customers as % of revenue
Key Takeaways for Credit Underwriters
- The EBITDA bridge is where credit risk is manufactured. In a high-leverage environment, every dollar of unjustified add-back has a disproportionate impact on implied leverage, covenant headroom, and ultimate recovery, making add-back discipline the single highest-leverage point in the underwriting process.
- Credit-Agreement EBITDA and QoE EBITDA are not the same number. The credit agreement's EBITDA definition governs covenant compliance for the life of the loan. It must be more conservative than the deal-marketing figure, not equivalent to it. Lenders who accept QoE EBITDA as their covenant baseline are granting hidden leverage at origination.
- Distressed restructurings are the dominant default form in 2026. With roughly 65% of 2025 private credit defaults taking the form of distressed exchanges, not hard payment defaults, the real stress in a portfolio often precedes technical default by 12–24 months. A tightly defined, independently calculated covenant EBITDA is the earliest warning system available to lenders.
- Recovery rates are declining, not improving. Expected first-lien recovery rates have declined to approximately 68% from historical averages in the high 70s, driven by loan-only capital structures with little junior debt beneath them. Every basis point of excess leverage at origination directly erodes the lender's recovery position if the enterprise value falls short at workout.
- Post-close monitoring is an underwriting obligation, not a portfolio management afterthought. Run-rate add-backs create ongoing credit risk that only resolves (or crystallizes) after closing. Monthly tracking of realized savings against the add-back schedule, with pre-agreed covenant reset triggers, is the discipline that separates professional credit platforms from yield-chasing capital.


