
Underwriting & Risk Management, Bond Capital Editorial Desk
EBITDA Adjustments and Normalization in Credit Underwriting: A Practitioner’s Framework for Defensible Earnings Analysis
September 21, 2026
The Underwriting Challenge: When the Number on the Page Is Not the Number You Lend Against
Every credit committee in private lending eventually confronts the same problem: a borrower arrives with an Adjusted EBITDA schedule that is substantially higher than what the audited financials show. Management adds back a legal settlement as “one-time.” They capitalize recruiting costs that have recurred for three straight years. They exclude the CEO’s above-market compensation on the assumption a replacement would cost less. Each adjustment carries a rationale. Collectively, they can obscure the true earnings power of the business by 20%, 30%, or more.
This is not a marginal problem. Every dollar of inflated or unjustified Adjusted EBITDA has a disproportionate impact on valuation and deal returns, because EBITDA is the denominator in the leverage ratio, the anchor for covenant compliance, and the basis on which debt capacity is sized. A lender who accepts a seller’s schedule uncritically is not underwriting a loan; they are financing an aspiration.
The credit environment has tightened the stakes further. Senior debt covenants tightened through 2025 as the credit cycle matured, which forced sponsors to underwrite tighter Adjusted EBITDA definitions. In parallel, private credit default rates rose, Fitch reported the U.S. private credit default rate reaching a record 6.0% in mid-2026, and Moody’s estimated that distressed restructurings accounted for approximately 65% of all private credit defaults in 2025. Many of those credit events trace directly back to earnings bases that were accepted too permissively at origination.
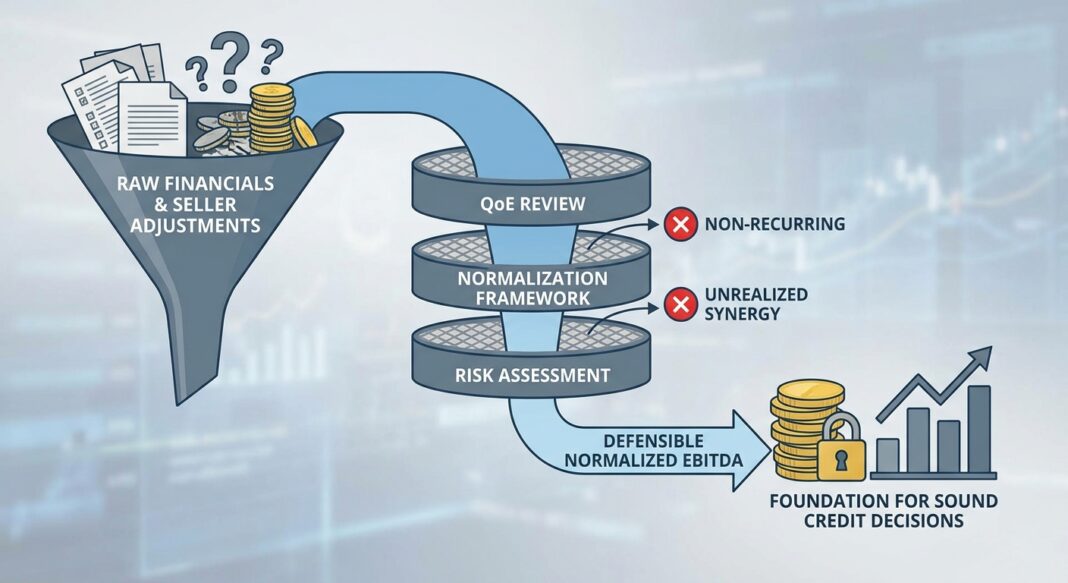
This article provides the analytical framework Bond Capital uses to move from a seller’s Adjusted EBITDA schedule to a lender-defensible normalized EBITDA figure, and explains how that number governs every subsequent credit decision.
The Framework: Four Layers of EBITDA Adjustment
Experienced credit practitioners distinguish between reported EBITDA, adjusted EBITDA, normalized EBITDA, and credit-agreement EBITDA. These are not interchangeable terms. Understanding the distinction between them is the first discipline of rigorous underwriting.
- Reported EBITDA: Net income plus interest, taxes, depreciation, and amortization as stated in the financial statements. This is the starting point, never the conclusion.
- Adjusted EBITDA (seller-presented): The seller’s bridge from reported to adjusted earnings, typically prepared by the sell-side advisor. Lenders treat this as a starting point, not a conclusion. Seller-provided schedules are viewed as a starting point, not a conclusion.
- Normalized EBITDA (QoE-verified): The earnings figure produced after an independent Quality of Earnings (QoE) review by a third-party accounting firm: typically Big Four, BDO, RSM, or Grant Thornton. This is the figure that survives diligence. Four parties touch the EBITDA calculation in every deal: the seller’s CFO, the sell-side M&A advisor, the buyer’s QoE firm, and the lender’s underwriting team.
- Credit-Agreement EBITDA: The definition embedded in the credit agreement, which governs covenant compliance for the life of the loan. This definition is often more conservative than QoE-Adjusted EBITDA and is the operative metric once the loan is funded.
The normalization process applies adjustments across four categories, each carrying a different evidentiary standard:
| Category | Examples | Lender Acceptance |
|---|---|---|
| Owner Compensation Normalization | Above-market owner salary replaced with market replacement cost | Generally accepted with compensation benchmarks; must cite BLS or industry survey data |
| Non-Recurring Items | One-time legal fees, M&A transaction costs, severance, facility exit charges | Accepted if documented as truly non-recurring; rejected if pattern repeats ≥2 years |
| Non-Cash Charges | Stock-based compensation (SBC), impairments, depreciation on non-operational assets | SBC add-backs increasingly rejected; SBC represents real economic dilution and is excluded from debt capacity calculations by many PE buyers |
| Pro Forma / Run-Rate Items | Synergy savings, headcount reductions not yet executed, new contracts not yet signed | Strictly scrutinized; synergy add-backs with realization periods are now permitted only if realized within 18 months of closing, with documentation reviewed by an independent accounting firm |
Owner compensation normalization remains the largest single adjustment category. BDO’s 2024 QoE benchmark study found owner-comp normalization is the largest single category, averaging 35% of total adjustments in lower-middle-market deals. Normalization commonly adds 15 to 40 percent to reported EBITDA in closely held businesses where owner compensation exceeds a market replacement salary.
The Analysis: Walking Through a $10M EBITDA Manufacturing Company
Consider a lower-middle-market industrial manufacturer presenting the following seller’s schedule. The company reports $7.2M in EBITDA. The seller’s advisor bridges to $10.4M Adjusted EBITDA, a 44% uplift, through the following adjustments:
| Adjustment Line Item | Seller Claim | Lender Assessment | Accepted Amount |
|---|---|---|---|
| Owner Compensation Above Market | $1,100,000 | Market replacement benchmarked at $350K; delta accepted | $750,000 |
| One-Time Legal Settlement | $500,000 | Verified non-recurring; occurred once in 5-year history | $500,000 |
| Stock-Based Compensation | $300,000 | Rejected, represents real economic cost; recurs annually | $0 |
| Facility Consolidation Savings (Unexecuted) | $650,000 | Rejected, headcount reduction not yet completed; speculative | $0 |
| Non-Cash Impairment Charge | $400,000 | Accepted with documentation | $400,000 |
| COVID-Era EBITDAC Adjustment | $250,000 | Rejected, dead adjustment category in 2026 | $0 |
| Lender-Accepted Normalized EBITDA | $10,400,000 (seller) | – | $8,850,000 |
The $1.55M delta between the seller’s figure and the lender’s accepted figure has immediate structural consequences. If the deal is priced at 5.0x EBITDA leverage, the seller’s figure supports $52.0M in senior debt. The lender’s figure supports only $44.25M: a $7.75M gap that either requires a price reduction, additional equity, or forces the deal to fail to close on the agreed terms. As practitioners note: a seller whose add-backs are rejected by the lender’s QoE team will face a buyer who cannot close the deal at the agreed price because the financing does not work at that EBITDA base.
Stress Testing the Normalized Figure
Normalization alone is insufficient for credit underwriting. Once the lender’s accepted normalized EBITDA is established, it must be stress-tested. A minimum of three scenarios should be modeled:
- Base Case: Normalized EBITDA held flat; interest coverage ratio tested at current SOFR + spread (currently SOFR + 400–600 bps for typical direct lending structures)
- Downside Case: Normalized EBITDA haircut 15–20% for revenue softness or margin compression; confirm DSCR remains above 1.10x–1.15x
- Severe Downside: EBITDA reduced 30%; identify minimum cash generation and evaluate covenant cushion to determine breach risk and time-to-distress
Industry Standards: What Institutional Lenders Require
Portfolio-Level Benchmarks (Current Data)
Institutional direct lenders publish portfolio-level metrics that provide credible benchmarks for underwriting standards. Based on public filings from a representative middle-market direct lender (Nuveen Churchill Direct Lending Corp., 10-Q filings, 2025–2026):
📊 Direct Lending Portfolio Benchmarks (June 30, 2026)
- Weighted average net leverage (first-lien): 5.20x Debt/EBITDA
- Weighted average interest coverage (first-lien): 2.46x
- Percentage of portfolio with financial maintenance covenants: ~86%
- Weighted average EBITDA of portfolio companies: $76.9M
Source: Nuveen Churchill Direct Lending Corp., SEC Form 10-Q, FY2026 (June 30, 2026)
📊 Typical Direct Lending Structure (2025–2026 Market)
- Pricing: SOFR + 400–600 bps, floating rate, four-to-six year term
- Maximum leverage covenant: ~4.0–5.25x EBITDA
- Minimum interest coverage: ~2.5x (minimum threshold; 2.27–2.46x observed in active portfolios)
- Average loan size: Exceeded $80 million since 2022
- Maintenance covenant prevalence: Approximately 87% of middle-market deals under $50M EBITDA carry at least one financial maintenance covenant
Source: Investing.com, “Private Credit in 2026: Record Defaults, Softer Returns and New Regulatory Focus”
📊 Private Credit Default Rate Data (2025–2026)
- Moody’s estimated private credit default rate (2025): 1.6%–4.7%, depending on treatment of distressed exchanges
- Distressed restructurings as share of all defaults (2025): ~65%
- Fitch U.S. private credit default rate (April 2026): 6.0% (broader definition)
- Proskauer Private Credit Default Index (Q2 2026): 2.51% across 716 loans / $195.6B
- Cliffwater Direct Lending Index return (calendar 2025): 9.3%, with 10.4% interest income component
Sources: Moody’s, “Default Rates Are Easing. Credit Risk Is Fragmented and Fragile Across Markets” (April 2026); Investing.com, “Private Credit in 2026” (August 2026)
Common Red Flags in EBITDA Normalization Schedules
Experienced underwriters have seen every variant of aggressive normalization. The following add-backs are near-universally stripped by institutional QoE teams:
- Unrealized synergies from a not-yet-signed contract or integration plan not yet executed
- Phantom cost saves from a headcount reduction the seller has not completed
- Revenue add-ons for a customer contract that has not been renewed or signed
- COVID-era EBITDAC adjustments: no longer accepted in 2026 diligence processes
- Stock-based compensation treated as fully non-cash when it drives real dilution and represents ongoing compensation cost
- One-sided margin adjustments: removing costs without acknowledging the revenue they support creates an internally inconsistent margin profile that QoE teams will identify and reject
The broader credit discipline emerging in the market is clear: the bridge between reported and Adjusted EBITDA is no longer just a negotiating artifact; it is a red flag in the eyes of investors and diligence teams that needs to be proactively addressed. The 2025–2026 market has moved toward a more conservative posture, with sponsor LOIs in the lower-middle market routinely excluding all stock-based compensation add-backs, a practice that was standard as recently as 2021.
Underwriting Checklist: EBITDA Normalization Diligence
The following checklist represents the minimum documentation and analytical steps required before a lender accepts any normalized EBITDA figure as the basis for credit sizing.
-
Obtain Three-to-Five Years of Audited or Reviewed Financials
A single year of normalized EBITDA can misrepresent performance; weight a 3-to-5-year trailing average to identify trends, cyclicality, and recurring “one-time” charges. -
Build an Independent Add-Back Bridge
Do not start from the seller’s schedule. Build the bridge from scratch using source documents (general ledger, payroll records, tax returns, contracts). The seller-provided schedule is a cross-reference, not a template. -
Apply the Three-Part Test to Each Adjustment
(a) Can the adjustment be traced to underlying records? (b) Is the rationale clear and non-speculative? (c) Would the cost truly disappear or change under new ownership? If any answer is “no,” the add-back fails. -
Benchmark Owner Compensation Against Market Data
Use BLS Occupational Employment and Wage Statistics and industry-specific compensation surveys. Accept only the delta between actual compensation and a documented market replacement salary. -
Segregate Historical Normalization from Pro Forma Assumptions
Price is set on history. Upside belongs in the buyer’s return model. Any adjustment that relies on future events (revenue growth, synergy capture, headcount reductions) must be excluded from the lender’s normalized EBITDA base. -
Confirm the QoE Firm’s Scope and Mandate
Confirm that the QoE engagement covers: revenue quality and concentration, working capital sustainability, non-recurring item identification, contingent liability exposure, and management representation verification. -
Calculate Lender-Accepted Normalized EBITDA and Size Debt Capacity
Apply the accepted figure to leverage and coverage tests: (a) Total Debt ÷ Normalized EBITDA ≤ target leverage threshold (typically 4.0–5.25x for senior secured); (b) Normalized EBITDA ÷ Total Cash Interest ≥ 2.0–2.5x minimum coverage; (c) Normalized EBITDA minus CapEx and working capital requirements ≥ required DSCR. -
Run Downside Scenarios Before Final Credit Committee
Apply at least a 15–20% EBITDA haircut in the base downside scenario. Document the EBITDA level at which covenants breach, the time-to-distress at various burn rates, and the recovery path if a restructuring becomes necessary. -
Confirm Credit-Agreement EBITDA Definition Is Conservative
Ensure the credit-agreement EBITDA definition caps QoE add-backs at an acceptable percentage of total EBITDA (typical market practice: 5–10% cap on discretionary add-backs), excludes speculative synergies, and requires Big Four or nationally recognized firm sign-off for material adjustments. -
Document the Full Normalization Bridge in the Credit Memo
Every accepted and rejected add-back must be documented with the rationale and source evidence. This is the evidentiary record if the loan is later reviewed by credit committee, a regulatory examiner, or a workout team.
Key Takeaways
- Normalized EBITDA and Adjusted EBITDA are not the same thing. Normalized EBITDA reflects what a business demonstrably earned on a representative historical basis. Adjusted EBITDA, as presented by sellers, can include forward-looking pro forma assumptions that have no place in a lender’s earnings base.
- Every rejected add-back directly constrains debt capacity. Any add-back that lenders will not credit in their underwriting reduces available leverage, which either makes the deal uneconomic at the agreed price or forces a price reduction to restore the target leverage ratio. This is not a soft negotiating dynamic; it is a structural underwriting constraint.
- The credit-agreement EBITDA definition is the operative metric. QoE-Adjusted EBITDA matters for origination; Credit-Agreement EBITDA governs the borrower’s life under the loan. Lenders who allow generous EBITDA definitions in the credit agreement are writing future covenant waivers into the deal at closing.
- Distressed exchange activity signals that normalization failures are a systemic risk. With roughly 65% of 2025 private credit defaults taking the form of distressed restructurings rather than hard payment defaults, the data suggest that many stressed borrowers had earnings bases that were accepted too permissively, masking leverage risk that only surfaced under macroeconomic pressure.
- Conservative normalization is not conservatism for its own sake. Proper normalization builds lender confidence, supports realistic valuations, and reduces the risk of unpleasant surprises during underwriting or after closing. The discipline that prevents a deal from closing at an inflated EBITDA is the same discipline that prevents a future portfolio workout.


