
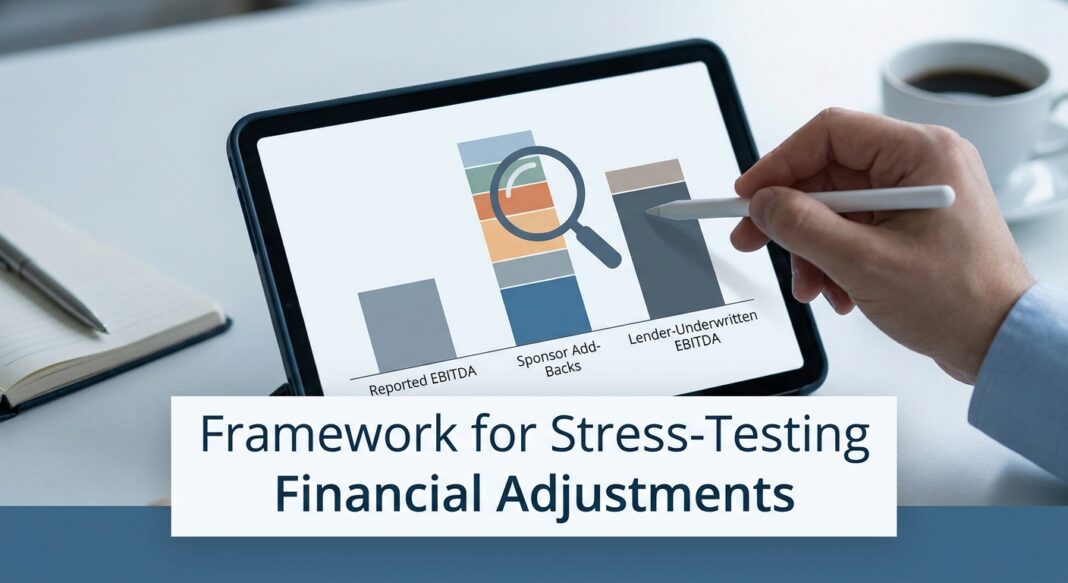
Underwriting & Risk Management
EBITDA Adjustments and Normalization: A Credit Underwriter’s Framework for Stress-Testing Sponsor Add-Backs
The Underwriting Challenge: What Are You Actually Lending Against?
A sponsor sends over a Confidential Information Memorandum. The company is a $60M-revenue industrial distributor. Reported EBITDA: $7.2M. Adjusted EBITDA in the CIM: $10.3M. The ask: $30M of senior secured first-lien debt at 4.5x leverage.
That $3.1M gap, 43% above reported earnings, is not unusual. It is, however, where credit decisions are won or lost. Every dollar in that bridge is a claim that the lender should extend credit against earnings the borrower has not yet proven it can reproduce.
The stakes are asymmetric and well-documented. As practitioners at PKF O’Connor Davies have observed, “the bridge between Reported and Adjusted EBITDA is no longer just a meme-worthy punchline, it’s a red flag in the eyes of investors and diligence teams.” Buyers and lenders now demand earnings bridges grounded in evidence, not optimism.
Lenders underwrite leverage and coverage ratios directly against Adjusted EBITDA. An inflated figure does not simply create a pricing disagreement; it produces a structurally overleveraged credit from day one, long before the first covenant test. The underwriter’s job is to reconstruct a defensible, sustainable earnings base before committing capital. This guide shows exactly how.
The Framework: Three-Layer Normalization Methodology
EBITDA normalization is not a single calculation; it is a structured, three-layer analytical process. Each layer carries a different burden of proof and a different risk profile for the lender.
Layer 1: Definitional Adjustments
These are the mechanics of EBITDA itself: adding back interest expense, income taxes, depreciation, and amortization to net income. These are universally accepted and rarely contested. They exist to normalize for capital structure and accounting treatment differences across companies.
Layer 2: Quality-of-Earnings Adjustments
These back out genuinely non-recurring items: a one-time legal settlement, a gain on asset sale, or severance from a completed workforce reduction. The critical test is recurrence. As one practitioner framework notes, quality-of-earnings adjustments address items that are “one-time in nature: a settled lawsuit, a building sale, severance from a layoff that will not recur.” The lender must verify the item appeared only once across the trailing three-year general ledger, not just in the current period.
Layer 3: Normalization Adjustments
This is where underwriting rigor is most required. Normalization adjustments fix ongoing costs that are priced incorrectly relative to market reality: owner compensation above or below market rates, related-party rent at non-arm’s-length terms, or family members on payroll without substantiated roles. During underwriting, lenders scrutinize discretionary expenses, verify that executive compensation aligns with market benchmarks, and confirm that related-party transactions are adjusted to reflect actual economic substance.
The Measurement Period: LTM vs. Run-Rate vs. Pro Forma
The period matters as much as the adjustments. LTM (Last Twelve Months) EBITDA is the standard starting point, but sponsors frequently argue for run-rate projections based on recent contract wins, cost reductions, or acquisitions not yet fully reflected. Each pro forma claim requires independent verification with a clearly defined realization timeline. Experienced underwriters independently assess each adjustment to determine whether it is reasonable, documented, and supportable, treating the seller’s schedule as a starting point, not a conclusion.
Working Example: $10M EBITDA Manufacturing Company
| Earnings Bridge Item | Seller Claim | Lender-Accepted | Rationale |
|---|---|---|---|
| Reported EBITDA | $7,200,000 | $7,200,000 | Verified baseline |
| Legal settlement (one-time) | +$400,000 | +$400,000 | Documented, no recurrence |
| Owner compensation above market | +$600,000 | +$350,000 | Comp benchmarked to BLS/market data; partial credit |
| Related-party rent adjustment | +$250,000 | +$250,000 | Third-party lease comps confirmed |
| Management consulting fees (recurring) | +$300,000 | $0 | Appeared in three consecutive years, not one-time |
| Stock-based compensation add-back | +$200,000 | $0 | Genuine compensation cost; excluded per 2026 market standard |
| Pro forma synergies (unverified) | +$350,000 | $0 | No realization documentation; excluded pending review |
| Lender-Underwritten EBITDA | $10,300,000 | $8,200,000 | $2.1M haircut applied |
The Analysis: From EBITDA to Debt Capacity and Coverage
Once a defensible EBITDA base is established, the underwriter works through three critical calculations: leverage, coverage, and stress scenario modeling.
Step 1: Leverage Multiple
Using the lender-adjusted EBITDA of $8.2M, the $30M debt request implies a leverage ratio of 3.66x, materially different from the 2.91x implied by the seller’s $10.3M figure. At 3.66x total debt-to-EBITDA, the credit sits in a meaningfully riskier position, especially if the borrower is floating-rate and faces the refinancing environment that has challenged loan-only capital structures in recent years.
Step 2: Debt Service Coverage Ratio (DSCR)
DSCR measures how much operating cash flow is available to cover interest and principal obligations. The formula: Net Operating Income (adjusted EBITDA less cash taxes and maintenance capex) divided by annual debt service.
- Adjusted EBITDA: $8,200,000
- Less maintenance capex (est. 2.5% of revenue): ($1,500,000)
- Less cash taxes (est.): ($400,000)
- Net Operating Cash Flow: $6,300,000
- Annual debt service ($30M at 9.5%, 5-year term): ~$4,750,000
- DSCR: 1.33x
A DSCR of 1.33x provides a 33% cash flow cushion above break-even debt service. Most middle-market lenders set minimum DSCR covenants at 1.25x, with a strong preference for ratios approaching 2.0x. A result of 1.33x is passing, but thinly. It leaves limited buffer for revenue compression, working capital surprises, or rate increases.
Step 3: Stress Scenario Analysis
The underwriter then applies a downside scenario: a 15% EBITDA contraction (consistent with a moderate revenue decline or margin compression event).
- Stress EBITDA: $6,970,000
- Stress Net Operating Cash Flow: $5,070,000
- Stress DSCR: 1.07x
At 1.07x in the stress case, the borrower is near break-even debt service with virtually no buffer. This stress scenario should inform covenant cushion design and amortization structuring. Had the underwriter accepted the sponsor’s $10.3M EBITDA without adjustment, the credit would appear robust, when in practice a moderate business shock creates covenant breach conditions.
Industry Standards: What Institutional Lenders Scrutinize in 2026
Several structural shifts define the current underwriting environment and sharpen the stakes for EBITDA normalization discipline.
The Add-Back Tightening Cycle
The credit market has moved to a distinctly more conservative posture on discretionary add-backs. The most significant change in 2025–2026 practice is lender and sponsor pushback on stock-based compensation (SBC) add-backs. Per the 2025 Federal Reserve Senior Loan Officer Survey, senior debt covenants tightened through 2025 as the credit cycle matured, forcing sponsors to underwrite tighter Adjusted EBITDA definitions. Sponsor letters of intent in the lower middle market now routinely exclude all SBC add-backs, a reversal from 2021 when SBC add-backs were standard across the market.
A related shift: pro forma synergy add-backs are now accepted in covenant calculations only when they carry documented realization timelines, typically within 18 months of closing, reviewed by an independent accounting firm. This brings discipline to a category that was previously a matter of sponsor discretion.
The QoE Mandate: A Regulatory Benchmark
The underwriting standard is becoming codified at the regulatory level. Starting October 1, 2026, the SBA will require an independent Quality of Earnings report on 7(a) change-of-ownership loans for initial acquisitions priced at $3 million in enterprise value or more. The report must reconcile accountant-prepared statements, tax returns, internal financials, and IRS transcript data into a single normalized earnings figure, with every add-back (including non-recurring items, owner compensation, related-party transactions, and cash-versus-accrual differences) documented and evaluated against historical reported Net Income. This is one of the most consequential underwriting changes the 7(a) program has seen in years, and it signals where institutional credit standards are heading broadly.
Credit Performance Data Box
📊 Key Credit Market Data: 2025–2026
- Private credit default rate (2025, broad): Moody’s estimates the private credit default rate ranged between approximately 1.6% and 4.7% in 2025, depending on whether distressed exchanges are included in the measurement. (Source: Moody’s, April 2026)
- Distressed restructurings as a share of all defaults: Moody’s Ratings data shows that in 2025, approximately 65% of all corporate defaults were distressed restructurings (including workouts, indenture modifications, and debt-for-equity swaps) rather than hard payment defaults. (Source: Moody’s, July 2026)
- Leveraged loan default forecast: Moody’s projected the leveraged loan default rate to peak near 7.9% in Q1 2026, nearly double the 3.4% historical average, before declining to approximately 7.3% in Q2 2026. (Source: Moody’s Credit Strategy, July 2025)
- First-lien recovery rates: Moody’s has estimated expected ultimate recoveries on U.S. first-lien loans at approximately 68%, versus the long-run historical experience in the high 70s, a meaningful deterioration driven by loan-only capital structures and covenant-lite documentation. (Source: CLO Data / Moody’s Ultimate Recovery Database, 2026)
- Private credit AUM growth: Corporate lending assets under management in private credit are expected to exceed $2 trillion in 2026 and grow toward $4 trillion by the end of the decade, with growth concentrated in structures that can obscure underlying leverage, including covenant-lite documentation and PIK income. (Source: Moody’s, April 2026)
- U.S. private credit defaults, Q2 2025: U.S. private credit defaults rose to approximately 5.5% in Q2 2025, up from 4.5% in Q1, reflecting stress in privately placed corporate debt. (Source: CoinLaw / Aggregated Agency Data, 2026)
The Covenant-Lite Risk Dimension
An underwriter who approves a credit against inflated EBITDA compounds the problem if the loan is also covenant-lite. Lenders holding covenanted loans detect borrower stress early and have quarters to restructure, protect recovery value, and manage their own portfolio timeline. Lenders holding covenant-lite positions often discover the problem only at payment default, by which point less enterprise value remains and fewer restructuring options preserve creditor returns. S&P data indicates that first-lien covenant-lite loans have historically produced meaningfully lower recovery rates compared to loans carrying financial maintenance covenants, highlighting why documentation quality and EBITDA accuracy are directly linked to loss severity outcomes.
Underwriting Checklist: EBITDA Normalization Diligence
The following step-by-step framework should be applied to every credit opportunity where normalized EBITDA underpins leverage and coverage underwriting.
Phase 1: Documentation Assembly
- ☐ Obtain three full fiscal years of audited or reviewed financial statements plus current year-to-date management accounts
- ☐ Obtain federal tax returns for the same three-year period and reconcile to financial statements
- ☐ Request the full general ledger, not summary-level reports, for the trailing twelve months
- ☐ Obtain the seller’s detailed add-back schedule with GL account-level support for each claimed adjustment
- ☐ Confirm whether an independent Quality of Earnings report has been commissioned; if not, determine who bears the cost and timeline
Phase 2: Add-Back Interrogation
- ☐ Apply the recurrence test: did each claimed non-recurring item appear in any of the three prior fiscal years?
- ☐ Benchmark owner and key-employee compensation against published market data (BLS OEWS, Robert Half, Mercer)
- ☐ Verify all related-party transactions (rent, management fees, intercompany loans) against arm’s-length comparables
- ☐ Exclude all stock-based compensation add-backs from the lender’s underwritten EBITDA per current market standard
- ☐ Require documented realization timelines (≤18 months from close) for any pro forma synergy or run-rate cost savings claims
- ☐ Test deferred maintenance assumptions: has capex been systematically understated to inflate reported cash flow?
Phase 3: Coverage and Stress Modeling
- ☐ Calculate DSCR using lender-accepted EBITDA less maintenance capex and cash taxes; confirm ≥1.25x base case
- ☐ Model a 15% EBITDA stress scenario; DSCR should remain above 1.0x with a covenant trigger set at 1.10x or 1.15x
- ☐ Sensitize leverage multiple across lender-accepted, base, and bear-case EBITDA; document the range
- ☐ Assess refinancing risk: can the borrower service debt at a 200bp rate increase in a floating-rate structure?
- ☐ Confirm first-lien recovery assumption in the credit memo; use 60–68% as a current base case per Moody’s guidance, not the historical 77%+ average
Phase 4: Covenant and Documentation Design
- ☐ Set financial maintenance covenants (leverage, DSCR, FCCR) with a cushion of 20–25% above current levels to provide early warning without triggering on minor fluctuations
- ☐ Define EBITDA for covenant purposes in the credit agreement with explicit add-back baskets, caps, and documentation requirements, do not incorporate open-ended “other adjustments” language without limits
- ☐ Require quarterly compliance certificates with lender-accessible management accounts; do not accept annual-only reporting for middle-market credits
Key Takeaways: Risk Management Insights
- Every add-back is a credit decision, not an accounting one. Each dollar of EBITDA uplift directly drives leverage multiples and debt sizing. Lenders who accept sponsor-provided adjustments without independent verification are underwriting against earnings the borrower may never produce.
- The recurrence test is the most powerful filter in your toolkit. Any expense that appeared in multiple prior years cannot be credibly claimed as non-recurring. Apply the three-year general ledger test to every line item in the add-back schedule.
- Stress-test DSCR before commitment, not after covenant breach. With leveraged loan default rates running near 7–8% and distressed restructurings representing the majority of credit events, thin coverage ratios in the base case translate directly to covenant triggers and loss events in moderate downside scenarios.
- Recovery rates are lower than historical models assume. Moody’s estimates current expected first-lien recoveries near 68%, well below the high-70s long-run average, driven by loan-only capital structures and covenant-lite documentation. Build this into loss severity assumptions from the outset, not as a post-default revision.
- Covenant discipline protects against EBITDA inflation at the documentation stage. Maintenance covenants with tightly defined EBITDA baskets (capped add-back categories, documented synergy timelines, and quarterly reporting requirements) give lenders the early warning signal that covenant-lite structures explicitly remove. Strong covenant design is the structural counterpart to rigorous normalization underwriting.


