
Why One Loan Is Replacing Two, and What That Means for Borrowers and Investors
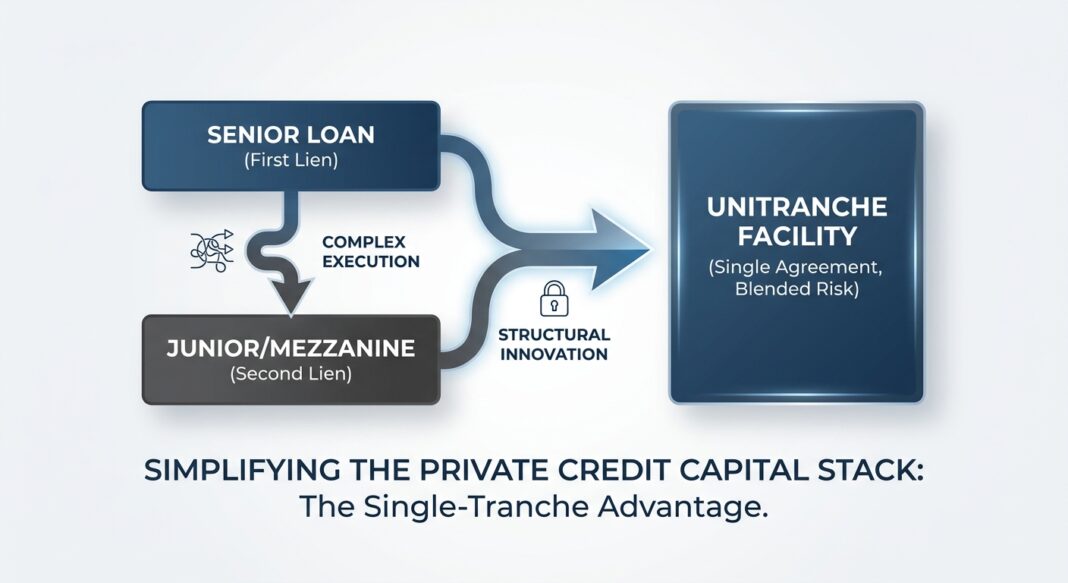
Somewhere between a bank’s senior loan and a mezzanine fund’s subordinated note, a structural innovation quietly displaced an entire layer of the capital stack. The unitranche loan: a single credit facility that blends first-lien and second-lien economics into one instrument, now dominates private credit deal flow in the U.S. middle market. It is not a niche product. According to Valuation Research Corporation (July 2026), unitranche structures continue to lead new issuance in direct lending, with all-in yields currently ranging from approximately 9.00% to 9.75%. Understanding how this structure works (mechanically, economically, and contractually) is foundational for anyone evaluating private credit as an investor or as a business owner seeking growth capital.
What a Unitranche Loan Actually Is
A unitranche facility is a single loan agreement that presents a unified interest rate to the borrower but internally splits economic risk between two classes of lenders through a private side document called an Agreement Among Lenders (AAL). The lender group is divided into a first-out tranche: which receives priority cash flows and lower risk, and a last-out tranche: which absorbs first losses and earns a higher implied yield in return. The borrower sees one rate, one set of covenants, and one administrative agent.
This structure emerged to solve a friction problem. Traditional first-lien / second-lien capital stacks required two separate loan agreements, two separate lender groups, and a complex intercreditor agreement negotiated between them. Execution could take months, and amendment processes required navigating two competing creditor constituencies. The unitranche collapsed that complexity into a single closing. As noted by Private Credit Hub (November 2025), the structure allows a sponsor to achieve certainty, confidentiality, and simplified execution, qualities that command a pricing premium over syndicated alternatives.
Sidley Austin (May 2026) notes that unlike broadly syndicated loan markets, private credit lenders rely on contractual protections, including financial maintenance covenants, to monitor performance and preserve value throughout the loan’s life. In a unitranche, those covenants typically include a quarterly-tested leverage ratio, making them structurally tighter than most broadly syndicated loans.
How the Mechanics Work: A Concrete Example
Consider a private equity sponsor acquiring a software services company with $10 million in EBITDA at a 6x multiple, a $60 million enterprise value. The deal requires $45 million in debt financing (4.5x leverage) and $15 million in sponsor equity. Here is how the capital structure compares across two approaches:
Traditional Two-Tranche Structure:
- Senior secured first-lien loan: $30 million at SOFR + 350 bps (~7.5% all-in)
- Second-lien mezzanine: $15 million at 12.0%–14.0% all-in
- Blended cost of debt: approximately 9.5%–10.0%
- Two loan agreements, two lender groups, intercreditor negotiation required
Unitranche Structure:
- Single unitranche facility: $45 million at SOFR + 500 bps (~9.0%–9.5% all-in)
- 2.0% original issue discount (OID) at funding: borrower receives $44.1 million, owes $45 million
- Prepayment schedule: 102 / 101 / par in years 1, 2, and 3+
- One loan agreement, one lender or a managed club, single amendment process
The blended cost difference between the two approaches is often narrow, sometimes less than 50 basis points, but the operational difference is substantial. The unitranche closes faster (typically two to three weeks for a committed financing versus six to ten weeks for a syndicated process), provides certainty against market flex, and simplifies ongoing covenant management. According to CT Acquisitions (June 2026), standard unitranche OID in 2026 runs 2%–3%, and the standard prepayment schedule is 102 / 101 / par, factors that materially affect the true cost of capital if a company refinances early.
Current Market Reality: Where Unitranche Pricing Stands in 2026
The unitranche market has repriced meaningfully from its 2023 peak, but not uniformly. Investors evaluating new commitments should understand the following data points:
| Metric | Current Level (2026) | Source |
|---|---|---|
| Unitranche all-in yield range | ~9.00%–9.75% | VRC, July 2026 |
| New-issue private credit spread (avg, Aug 2026) | 502 bps over SOFR | Kadenwood / PitchBook LCD, Sept 2026 |
| Premium over syndicated loans | ~162 bps | Kadenwood / PitchBook LCD, Sept 2026 |
| Global private credit AUM | ~$1.7 trillion | CT Acquisitions / Preqin, July 2026 |
| Cliffwater CDLI return, trailing 12 months to June 2026 | 7.7% | Investing.com / Cliffwater, Aug 2026 |
| Senior secured first-lien recovery rate (2022–2025 cohort) | ~68 cents on the dollar | CT Acquisitions / Moody’s, July 2026 |
Two dynamics are reshaping the market’s risk-return profile simultaneously. First, spreads on new-issue private credit have widened from 475 bps in Q1 2026 to 502 bps through August 2026, according to PitchBook LCD data reported by Kadenwood (September 2026). In Q1, just 25% of sponsor-backed direct lending deals priced between 500–549 bps; by August that band captured 52% of deals. The middle of the market moved up a full pricing band in months.
Second, covenant quality has improved alongside wider spreads. According to Lord Abbett (June 2026), new loans are increasingly coming with better credit structures, a shift that matters more than the spread move alone. That said, competitive pressure in large-cap deals has also introduced “covenant-loose” terms in certain segments, where maintenance covenants technically exist but are set with cushions so generous they are unlikely to be triggered, as noted by Troutman Pepper Locke (May 2025).
Bank lending standards provide the macro backdrop. The Federal Reserve’s July 2026 SLOOS reported broadly unchanged C&I lending standards for Q2 2026, a stabilization after several quarters of tightening, but banks simultaneously reported tighter standards for loans to non-depository financial institutions (NDFIs), which include private credit fund credit lines. That dynamic narrows the cheap leverage available to some direct lending platforms, a structural tailwind for lenders with dry powder and balance-sheet funding.
Decision Framework
For Investors Evaluating Unitranche Exposure
- Yield vs. structure: A 9.0%–9.75% all-in yield on a senior secured unitranche reflects a meaningful illiquidity premium over public alternatives. Investors should verify that the premium compensates for illiquidity, lower liquidity on secondary sales, and the absence of daily mark-to-market pricing, not just credit risk.
- Covenant quality: Evaluate whether the fund’s unitranche portfolio carries true maintenance covenants with meaningful headroom, or looser incurrence-based structures. Carta (December 2025) notes that maintenance covenants appear in roughly two-thirds of deals under $250 million, but drop to only 7% of deals above $500 million, a key distinction by deal size and strategy.
- First-out vs. last-out exposure: In an AAL structure, the last-out position absorbs first losses. Investors should confirm whether a fund holds first-out, last-out, or full-ticket unitranche positions, as the loss profile differs substantially.
- Loss rate context: The Cliffwater Direct Lending Index, as cited by Dechert (June 2026), recorded realized losses of just 0.70% in 2025 across all BDC-held loans, below the 1.01% long-run average, but investors should understand that definitional differences across agencies (Fitch, Moody’s, Cliffwater) produce materially different reported default rates for the same underlying universe.
For Operators Evaluating Unitranche Financing
- When unitranche makes sense: CT Acquisitions (July 2026) notes that for lower-middle-market LBOs ($50M–$500M enterprise value), unitranche typically offers faster closing, certainty of execution, and a single lender for amendments, advantages that often outweigh the pricing premium over bank alternatives. The $50M–$200M EV band is where direct lenders compete most aggressively and offer the most flexible terms.
- Model the true cost: Compare the unitranche all-in cost (including OID, floors, and the prepayment schedule) against a flexed bank or BSL alternative. CT Acquisitions (June 2026) shows that broadly syndicated loans for B2/BB- credits price at SOFR + 350–500 bps in 2026, approximately 100–150 bps tighter than comparable unitranche, but with higher execution risk and no certainty of hold.
- Understand maintenance covenants: A unitranche will almost certainly include a quarterly leverage covenant. Operators with cyclical or acquisition-driven revenue profiles should negotiate covenant headroom and equity cure rights before closing, not during a compliance breach.
Key Takeaways
- One loan, two economics: The unitranche presents a single rate to the borrower but internally allocates risk between first-out and last-out lenders through a private Agreement Among Lenders, giving direct lenders flexibility to syndicate risk while maintaining deal simplicity for borrowers.
- Pricing has normalized but is widening: New-issue unitranche all-in yields sit around 9.0%–9.75% as of mid-2026, down from a 2023 peak near 12.5%, but spreads have widened approximately 27 bps since Q1 2026, and the mid-market pricing band shifted upward materially through August.
- The premium is real but scrutinize it: Private credit commands approximately 162 bps over comparable syndicated loans as of August 2026. That premium compensates for illiquidity, speed, and certainty, not necessarily incremental credit risk, making structural analysis as important as spread analysis.
- Covenants are private credit’s edge: Maintenance-tested leverage covenants remain the standard in middle-market unitranche deals under $250 million, functioning as an early-warning system that broadly syndicated, covenant-lite loans do not provide.
- Loss rates and default rates are not the same: Cliffwater’s realized loss methodology and Fitch’s default-count methodology produce radically different headline numbers for the same market. Investors and operators should understand which metric a given source is reporting before drawing conclusions about private credit risk.


