
Underwriting & Risk Management
EBITDA Adjustments and Normalization in Credit Underwriting: How Lenders Build and Defend a Creditworthy Earnings Base
The Underwriting Question That Opens Every Credit File
A sponsor submits a CIM. The cover page announces $12.4M Adjusted EBITDA on a manufacturing platform they want to acquire at 7.5x. The implied enterprise value is $93M. The proposed debt stack is $62M: a 5.0x leverage ratio that, on the surface, looks manageable.
But the lender’s job is not to accept that EBITDA. The lender’s job is to rebuild it. Inside that $12.4M figure may sit $1.8M of add-backs that no creditor will ever underwrite: stock-based compensation treated as non-recurring, one-time consulting fees that have appeared in three consecutive years, and a related-party rent structure priced 40% below market. Strip those out, normalize owner compensation to a true market replacement cost, and the defensible earnings base might be $10.1M, implying a real leverage ratio of 6.1x, not 5.0x.
That gap is the difference between a credit that works and one that doesn’t. It is also the central discipline of EBITDA normalization in credit underwriting: constructing an earnings figure that reflects the cash a business will actually generate to service debt, not the earnings a seller or sponsor needs to make a deal pencil.
With private credit assets under management expected to exceed $2 trillion in 2026 and grow toward $4 trillion by the end of the decade, the volume of deals requiring this analysis has never been higher. So has the cost of getting it wrong.
The Analytical Framework: Four Layers of Normalization
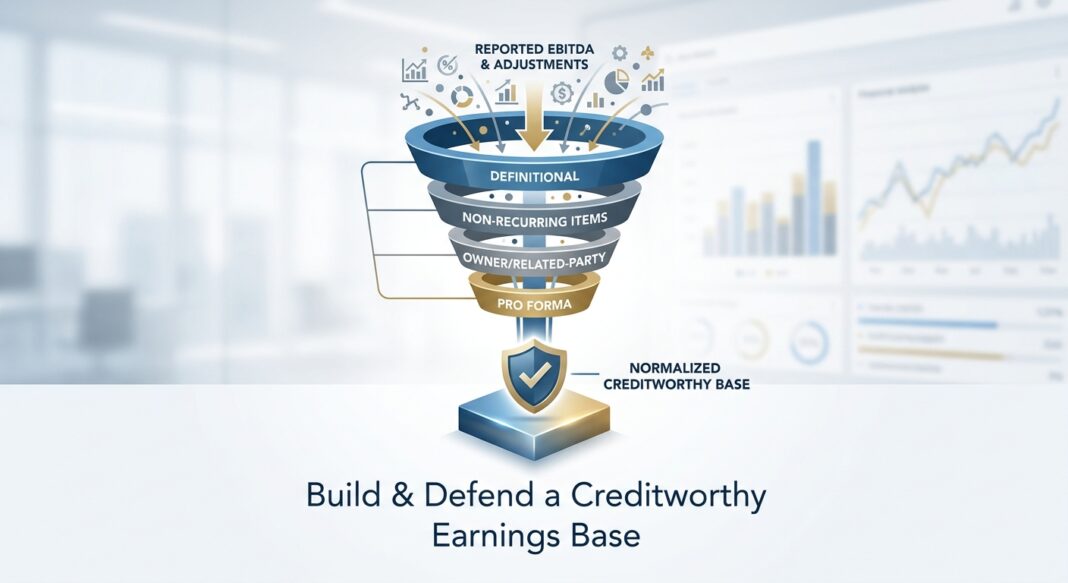
EBITDA normalization is not a single calculation. It is a four-layer process that moves from accounting definition to creditworthy run rate. Each layer requires independent validation, and each layer creates an opportunity for aggressive sellers or sponsors to embed value inflation that erodes credit quality at closing.
Layer 1: Definitional EBITDA
Start with reported net income and add back interest expense, income taxes, depreciation, and amortization. This is mechanical and largely non-controversial. However, even here, lenders must verify that depreciation schedules reflect actual economic wear and that deferred tax liabilities are not masking future cash costs. A business with severely underdepreciated equipment may require significant capital expenditure that a pure EBITDA lens misses entirely.
Layer 2: Non-Recurring Item Removal
Remove items that are genuinely one-time and non-operational: a settled IP lawsuit, a one-time facility relocation cost, severance from a completed restructuring. The operative test is straightforward but often disputed: will this cost recur in the ordinary course of business? A “one-off” legal expense appearing in three consecutive general ledgers is not one-off. Across buy-side diligence engagements, it is common for 10 to 30 percent of proposed add-backs to be disallowed, and on aggressive sell-side memoranda, the proportion can be higher.
Layer 3: Owner and Related-Party Normalization
Adjust owner compensation to market replacement cost. If the founding CEO earns $180,000 managing a $40M revenue business, the market replacement is likely $350,000–$420,000, a normalization downward. Conversely, if the owner draws $900,000 in compensation in a business that a professional manager would run for $400,000, the excess $500,000 is a legitimate add-back. The same logic applies to related-party real estate leases priced below market: the below-market subsidy must be normalized upward to reflect what the business would actually pay for the property under arm’s-length terms.
Layer 4: Pro Forma Adjustments
Pro forma adjustments (for acquisitions in the trailing period, new contracts already in the run rate, or implemented price increases) require the highest evidentiary standard. Implemented price increases may receive credit only if invoices and customer retention data confirm the increase is already generating revenue. Anticipated cost savings dependent on post-closing management action should be rejected until realized. Since 2025, sponsor agreements in the middle market increasingly restrict pro forma synergy add-backs to items realized within 18 months of closing, with documentation reviewed by an independent accounting firm.
📊 The Valuation Multiplier Effect
Because enterprise value is typically expressed as a multiple of EBITDA, every dollar of normalized EBITDA has an outsized impact on both deal price and debt capacity. At an 8.0x multiple, a $320,000 normalization difference represents $2.56M of enterprise value, and a corresponding shift in how much debt the capital structure can support. Lenders who accept the seller’s EBITDA without independent reconstruction are implicitly underwriting inflated leverage.
Walking the Calculations: A $10M EBITDA Manufacturing Company
Consider a hypothetical precision-parts manufacturer with a December fiscal year-end. The seller’s CIM presents $10.3M Adjusted EBITDA for the trailing twelve months ended June 2026. The proposed acquisition price is $77.25M (7.5x). The lender is being asked to provide $51.5M in first-lien senior secured debt (5.0x leverage).
The lender’s quality of earnings rebuild produces the following normalization waterfall:
| Line Item | Seller Claim | Lender Position | Delta |
|---|---|---|---|
| Reported EBITDA (LTM) | $8,200,000 | $8,200,000 | – |
| + Settled litigation expense (non-recurring) | $620,000 | $310,000 (recurring pattern) | ($310,000) |
| + CEO excess compensation above market | $480,000 | $320,000 (market replacement $580K) | ($160,000) |
| + Stock-based compensation | $350,000 | $0 (excluded per 2025–2026 market practice) | ($350,000) |
| + Related-party rent (below market) | $250,000 | $250,000 (accepted with comparables) | – |
| + Pro forma new contract revenue | $400,000 | $0 (invoices not yet issued) | ($400,000) |
| Lender-Underwritten EBITDA | $10,300,000 | $9,080,000 | ($1,220,000) |
The lender’s EBITDA is $9.08M-11.8% below the seller’s figure. At the proposed $51.5M debt load, leverage on the lender’s number is 5.67x, not 5.0x. Fixed charge coverage (EBITDA less capex, divided by debt service) compresses from 1.78x to 1.56x. At that level, even modest revenue softness of 8% pushes coverage below 1.40x, the threshold most institutional lenders treat as a covenant trigger floor.
The lending decision does not automatically become “no”, but the credit committee now knows the real risk it is pricing. Deal terms, including pricing, structural protections, and covenant headroom, must reflect the lender’s number, not the sponsor’s.
What Institutional Lenders Require, And What the Default Data Says
The normalization discipline described above is not optional for professional credit portfolios. It is the mechanism by which lenders protect against the single most common driver of post-close credit deterioration: an EBITDA base that was never real.
What Experienced Lenders Require
- Independent QoE from a recognized firm. A buyer’s lender will extend credit against a third-party quality of earnings report, and will not lend against the seller’s internal calculation. The independence is structural, not procedural, the QoE provider must have no economic interest in the deal closing.
- Minimum 3-year normalized history. A single year of adjusted EBITDA is insufficient. Lenders require three to five years of normalized financials to identify margin trends, working capital seasonality, and whether “one-time” items are actually recurring.
- Covenant definitions locked to the lender’s EBITDA. The credit agreement must define EBITDA consistently with the underwritten number. Sponsors who negotiate broad add-back baskets in covenant definitions effectively allow the leverage ratio to drift upward post-close without triggering maintenance tests.
- Stress-tested coverage ratios. Lenders should model EBITDA at a minimum 15–20% haircut from the normalized base to test covenant compliance under adverse conditions.
Credit Performance Data: The Cost of Getting Normalization Wrong
📊 Data Box: Default and Recovery Benchmarks (2024–2026)
- Private Credit Default Range (2025): Moody’s estimated the private credit direct lending default rate at approximately 1.6% to 4.7% for 2025, depending on whether distressed exchanges are included, a range that reflects the difficulty of measuring latent stress in opaque portfolios.
- Distressed Exchanges as a Share of All Defaults: Approximately 65% of all corporate defaults in 2025 were distressed exchanges rather than hard payment defaults, at or near the highest annual share on record. This means headline default rates materially understate credit stress.
- Leveraged Loan Default Rate Peak: By late 2024, the U.S. leveraged loan default rate climbed to a decade-high of 5.6%, driven largely by distressed exchanges, per FTI Consulting’s 2025 Leveraged Loan Market Survey.
- First-Lien Recovery Rates: Moody’s has estimated expected ultimate recoveries on U.S. first-lien loans at roughly 68%, versus long-run historical experience in the high 70s, a meaningful structural decline driven by loan-only capital structures and covenant-lite documentation.
- Add-Back Dispute Rate: The 2025 SRS Acquiom Buy-Side Representations & Warranties Insurance Claims Study found that 18% of post-closing M&A disputes traced to disagreements over EBITDA adjustment definitions in the purchase agreement.
- EBITDA Gap in Practice: The typical reported-to-adjusted EBITDA gap runs 20–30% of reported EBITDA. Wider gaps signal aggressive add-backs that lenders must challenge in diligence.
The recovery rate decline deserves particular attention. When first-lien lenders expect to recover approximately 68 cents on the dollar at default, versus the high-70s in prior cycles, the underwriting of the EBITDA base becomes even more critical. Lower recovery means that a bad loan must perform longer and deteriorate further before losses materialize, and that the loss severity when it does arrive is larger. Every dollar of overstated EBITDA at origination compounds into multiple dollars of potential realized loss at default.
Common Red Flags Lenders Should Watch
- Add-back schedules where non-recurring items exceed 25% of reported EBITDA
- Legal and consulting expenses labeled “one-time” in two or more consecutive years
- Stock-based compensation included as an add-back in the sponsor’s model but excluded by the lender’s QoE
- Pro forma revenue or cost synergies with no documentation supporting current run-rate realization
- Related-party leases, management fees, or intercompany charges not normalized to market rates
- Working capital adjustments that convert accrual-basis EBITDA to cash without explicitly modeling collection cycles
- Capital expenditure excluded from the coverage ratio in a capital-intensive business
The EBITDA Normalization Underwriting Checklist
The following checklist represents a minimum documentation and analytical standard for institutional credit underwriting of leveraged or acquisition finance transactions. Each step maps directly to a risk that has materialized in post-close defaults or covenant breaches.
-
Obtain and review 3–5 years of audited or reviewed financial statements.
Confirm consistency of accounting policies across periods. Note any changes in revenue recognition, depreciation method, or inventory accounting. -
Commission or obtain an independent Quality of Earnings (QoE) report.
Require preparation by a recognized transaction advisory firm. Confirm the firm has no contingent fee arrangement tied to closing. Review all proposed add-backs against supporting documentation. -
Reconstruct EBITDA from trial balance, not summary P&L.
Summary financials can mask working capital movements, customer concentration, and margin trends at the product or segment level. Require general ledger-level review for any add-back exceeding $100,000. -
Test every non-recurring item against a three-year look-back.
Any expense category that appears in more than one year, regardless of labeling, requires documentation and an independent judgment on recurrence probability. -
Normalize owner and key-person compensation to market.
Obtain third-party compensation benchmarks (BLS OEWS, Robert Half, or industry-specific surveys) for the relevant role and geography. Document the market replacement cost in the credit memo. -
Normalize all related-party transactions to arm’s-length terms.
Require lease comparables, management fee market benchmarks, and intercompany pricing documentation. Adjust EBITDA upward or downward as market economics dictate. -
Reject pro forma items without documented run-rate evidence.
Implemented price increases require invoice and retention data. New contracts require executed agreements with revenue recognized in the current period. Forward-looking synergies without realization evidence are excluded. -
Calculate three coverage metrics on the lender’s normalized EBITDA.
(a) Debt / EBITDA; (b) EBITDA / Interest Expense; (c) Fixed Charge Coverage Ratio (EBITDA – Capex – Taxes – Distributions) / (Interest + Scheduled Principal). Model all three at base case, at a 15% EBITDA haircut, and at a 25% haircut. -
Lock covenant definitions to the lender’s EBITDA in the credit agreement.
Resist broad add-back baskets in covenant EBITDA definitions that deviate from underwritten earnings. Require an EBITDA bridge schedule as an exhibit to the credit agreement. -
Establish ongoing monitoring with quarterly compliance certificates.
Require management-certified compliance certificates within 45 days of each quarter end, with normalized EBITDA calculated on a trailing twelve-month basis consistent with the credit agreement definition.
Key Takeaways for Credit Professionals
- The lender’s EBITDA is not the sponsor’s EBITDA. Institutional credit underwriting requires an independently reconstructed earnings base. Accepting a seller’s adjusted EBITDA without a QoE rebuild is not underwriting; it is price acceptance with credit risk attached.
- Normalization runs in both directions. A credible EBITDA schedule includes add-downs as well as add-backs. Below-market rent, underpaid owner labor, and deferred maintenance all reduce sustainable earnings and must be reflected before debt capacity is sized.
- The 2025–2026 market has made SBC add-backs a red line. Following Federal Reserve Senior Loan Officer Survey findings on covenant tightening through 2025, sponsor LOIs in the lower middle market now routinely exclude stock-based compensation add-backs, a reversal of 2020–2021 practice.
- First-lien recovery rate compression demands tighter upfront underwriting. With Moody’s estimating expected ultimate recoveries on U.S. first-lien loans at approximately 68%, below the long-run historical average, lenders cannot rely on collateral to compensate for earnings miscalculation at origination. The EBITDA base is the primary line of defense.
- Distressed exchanges obscure true credit stress. With approximately 65% of 2025 corporate defaults classified as distressed exchanges rather than payment defaults, headline default rates understate latent portfolio risk. Lenders must monitor normalized EBITDA trends continuously, not only at covenant compliance dates, to identify deterioration before it crystallizes into a restructuring event.


