
Credit Cycle at Inflection: Spread Widening, Structural Rotation, and the Lender-Friendly Reset Shaping Private Markets in H2 2026
Bond Capital | Market & Sector Intelligence Desk: October 9, 2026
Market Headline: A Lender-Friendly Reset Takes Hold
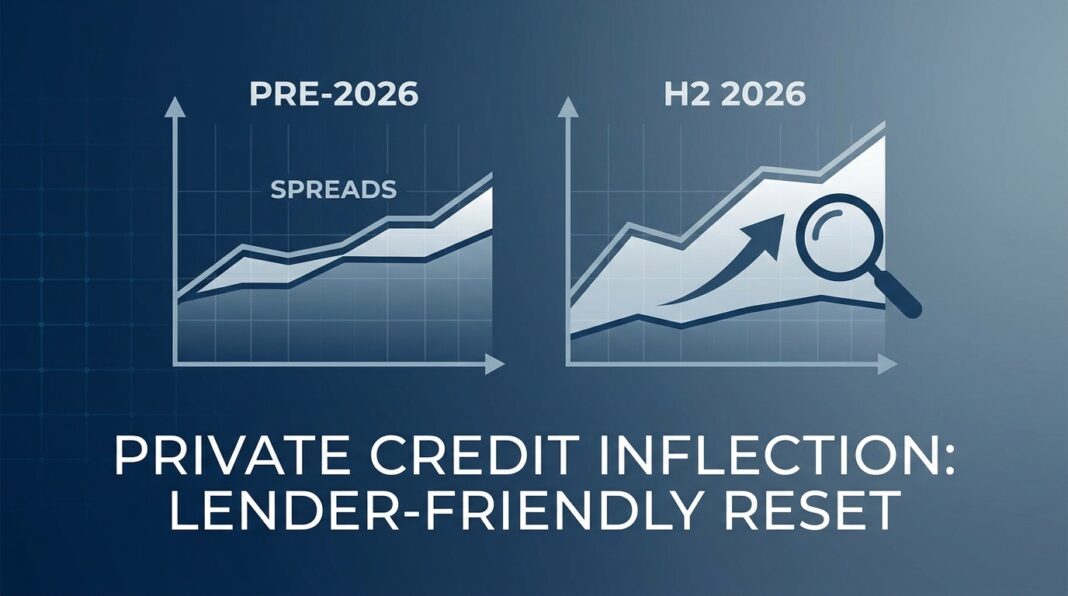
The U.S. private credit market is navigating its most significant repricing event since the 2008 financial crisis. After years of compressed spreads, covenant erosion, and lender concessions driven by excess dry powder, the pendulum has sharply reversed. Hamilton Lane reports that private credit spreads have re-widened into the S+500 basis point context, up from the mid-400s level that defined much of 2024–2025. The catalyst: a convergence of geopolitical shock, AI-driven software sector disruption, elevated base rates, and a historic spike in default activity.
Lord Abbett’s 2026 Midyear Outlook frames the dynamic precisely: spreads have widened roughly 50 to 100 basis points since late 2025, per PitchBook data, and more importantly, new loans are increasingly structured with less leverage, more covenants, fewer PIK requests, and tighter documentation. This is not merely a spread story; it is a structural reset in lender power. For operators seeking capital and institutional investors positioning portfolios, the market has materially changed in their respective favor and against them, depending on which side of the table they occupy.
Simultaneously, a capital rotation of historic proportion is underway beneath the headline numbers. Wellington Management, citing PitchBook, notes that direct lending’s share of private debt fundraising has collapsed from 58.4% in 2024 to just 31% by Q1 2026, as allocators redirect capital into infrastructure debt, asset-backed finance, real estate credit, and special situations, strategies better insulated from the corporate cash-flow compression now afflicting legacy 2021–2022 vintage loans.
Quantitative Market Snapshot
The table below presents key market metrics drawn from authoritative sources as of Q3 2026. All prior-period comparisons reference Q3–Q4 2025 unless otherwise stated.
| Metric | Current Value | Prior Period | Change | Source |
|---|---|---|---|---|
| Direct Lending Spread (Middle Market) | S+475 – S+525 bps | S+425 – S+450 bps (Q4 2025) | +50 to +75 bps wider | Hamilton Lane (2026) |
| 3-Month Term SOFR | ~3.68% | ~3.67% (Q1 2026) | +1 bp QoQ | VRC Q2 2026 |
| 5-Year U.S. Treasury Yield | ~4.23% (June 2026) | ~3.92% (March 2026) | +31 bps | VRC Q2 2026 |
| 10-Year U.S. Treasury Yield | 4.80% (Sep 9, 2026) | ~4.30% (prior quarter) | +50 bps | SOFR Rate / FRED (Sep 9, 2026) |
| Fitch U.S. Private Credit Default Rate | 6.0% (April 2026, LTM) | ~3.0% – 4.7% (2025) | Record high | CNBC / Fitch Ratings (May 2026) |
| Leveraged Loan LTM Default Rate (Issuer Count) | 1.36% (Feb 2026, excl. distressed exchanges) | 1.71% (10-yr avg) | Below historical avg | Hamilton Lane (2026) |
| Private Credit H1 2026 Fundraising | $262 billion | ~$201 billion (H1 2025) | +30% YoY | The Credit Crunch (June 2026) |
| Direct Lending Completed Transactions (Q2 2026) | 154 deals | 217 deals (Q1 2026) | -29% QoQ | Angel Investors Network / Q2 Data (Aug 2026) |
| Borrower FCCR (U.S. Middle Market) | 1.3x | Sub-1.0x lows (2024) | Recovering | Dancap / Lincoln International via BlackRock (2026) |
| Interest Coverage Ratio (ICR, U.S. Middle Market) | 1.9x | Depressed in 2024 | Improving | Dancap / Lincoln International via BlackRock (2026) |
| Typical ‘True’ Leverage in Private Credit | ~7x Debt/EBITDA | Reported headline often lower | Understated by adjustments | FSB Vulnerabilities in Private Credit Report (May 2026) |
| 2021-Vintage Leverage Drift | +0.9x increase since issuance | Underwritten at peak leverage | Cash interest coverage -0.4x | VRC Q2 2026 |
Note: All-in direct lending yields approximate S+500 on a 3-month Term SOFR base of ~3.68%, implying gross unlevered asset yields of approximately 8.5% to 9.2% for senior secured middle market loans as of mid-2026, before manager fees. The Cliffwater Direct Lending Index posted a trailing-year return of 7.7% through June 30, 2026, down from its 20-year average of 9.5%. (Investing.com / Cliffwater)
Macro & Regulatory Forces: The Higher-for-Longer Pressure Valve
The Federal Reserve’s July 2026 Senior Loan Officer Opinion Survey (SLOOS) delivered a nuanced verdict on bank credit conditions. KPMG’s analysis of the July 2026 SLOOS confirms that bank lending standards to businesses of all sizes were essentially unchanged in Q2 2026, representing a meaningful improvement from Q1 2026, when the April 2026 SLOOS showed net tightening of C&I standards. For commercial real estate, the July survey registered the most easing since early 2022, with the KPMG analysis noting that “some appetite for risk is returning.”
However, the April 2026 SLOOS revealed a critical structural dynamic: banks reported, on net, tighter standards for all categories of Non-Depository Financial Institution (NDFI) loans, including to private equity funds and business credit intermediaries. The most commonly reported tightening measures included higher risk premiums, stricter loan covenants, shorter maximum maturities, and lower credit line sizes. This means banks are not simply retrenching from end borrowers; they are squeezing the private credit funds themselves, raising the cost of fund-level leverage and constraining deployment capacity precisely when deal flow has slowed.
The monetary backdrop reinforces this pressure. Northleaf Capital’s Q1 2026 update notes that the Fed held its target rate at 3.50%–3.75% through Q1, citing elevated inflation pressures from geopolitical disruptions in the Middle East. VRC’s Q2 2026 report confirms that market expectations reflect a broadly flat forward curve as of June 2026, with no significant rate relief anticipated, a higher-for-longer regime that continues to erode interest coverage at debt-laden portfolio companies.
The Financial Stability Board’s May 2026 Report on Vulnerabilities in Private Credit identified the opacity of reported leverage as a systemic risk, noting that “true” debt-to-EBITDA in private credit portfolios may be closer to 7x once EBITDA adjustments and add-backs are stripped out, a figure materially higher than the headline ratios typically disclosed to LPs.
Sector Analysis: Winners, Losers, and the Capital Rotation Map
🔴 Under Stress: Software & Technology
No sector has borne more credit damage than software and technology. VRC Q2 2026 data sourced from PitchBook LCD shows software secondary spreads trading approximately 245 basis points wider than year-end 2025 levels and roughly 229 bps above the broader B-rated loan index as of June 19, 2026, driven by AI-driven disruption concerns. Lord Abbett estimates that software represents approximately 20% of private leveraged finance market exposure versus only ~13% in liquid markets, amplifying the sector’s outsized impact on private credit portfolios. Non-accrual rates at BDCs have risen materially, with Wellington reporting median non-accrual rates increasing from 0% in 2022 to 0.33% in Q1 2026, driven largely by technology and software sector stress.
🟢 Resilient Demand: Healthcare & Business Services
Octus Data shows that healthcare led all sectors in private credit deal volume in 2025, accounting for 19% of all direct lending deals. Creative Planning’s 2026 Private Credit Outlook notes that demographic shifts and non-cyclical service models continue to attract lenders seeking stable cash flows in healthcare. Business services, with recurring revenue and defensible margins, is similarly favored by senior direct lenders seeking low-volatility cash flows to support FCCR requirements. That said, Morgan Stanley maintains a significant underweight to healthcare, citing leading non-accrual performance, a reminder that aggregate sector popularity does not eliminate sub-segment credit risk.
🔵 Structural Growth: Infrastructure, Asset-Based Finance & Digital Infrastructure
The most consequential structural shift in private credit is the surge in asset-based finance (ABF) and infrastructure debt. Manhattan Private Credit, citing J.P. Morgan, highlights that the global investable ABF market is estimated at approximately $7 trillion, with private capital holding only a ~5% share compared to its ~9% share of corporate lending, indicating substantial room for growth. BlackRock’s 2026 Private Markets Outlook identifies asset-based financing as an area where it expects “a profound increase in opportunities in 2026.” In digital infrastructure, Morgan Stanley estimates that private credit could supply more than half of the $1.5 trillion needed for global data center buildouts through 2028.
🟠 Cautious Re-Entry: Commercial Real Estate (CRE)
CRE is showing early recovery signals. KPMG’s SLOOS analysis confirms that banks eased CRE lending standards at the fastest pace since early 2022 in Q2 2026, with stronger demand being reported by larger firms. Private lenders are cautiously re-engaging with stabilized assets in top-tier markets, though residential real estate remains constrained by elevated mortgage rates.
Implications for Institutional Investors & Operators
For Institutional Investors
The lender-friendly reset is real and quantifiable. Lord Abbett’s midyear analysis confirms that new loan structures are improving across every dimension: less leverage, more maintenance covenants, fewer PIK provisions, and tighter documentation. The Cliffwater Direct Lending Index (via Dancap/BlackRock) reports that trailing four-quarter realized losses have remained just 0.6% of income, but headline default rates now require careful disaggregation. Forbes/Forbes citing Moody’s reports that distressed restructurings accounted for roughly 65% of all 2025 private credit defaults; excluding them produces 1.6%–4.7% headline rates, while including them reveals a materially worse picture. Manager selection has never mattered more.
The fundraising bifurcation is also critical. The Credit Crunch’s H1 2026 analysis confirms that private credit managers raised $262 billion in H1 2026, up 30% year-over-year, but the ten largest managers captured the vast majority of inflows. Smaller and mid-size managers face genuine deployment pressure, which may incentivize credit standard erosion. Allocators should scrutinize deployment pacing, portfolio vintage concentration, and the ratio of PIK income to cash interest across any new commitment.
VRC’s analysis of 2021–2022 vintage portfolios is a key risk flag: leverage has increased by approximately 0.9x while adjusted cash interest coverage has declined by roughly 0.4x since issuance. As these loans approach maturity, refinancing risk is elevated, increasing the probability of liability management exercises (LMEs), restructurings, or forced asset sales across legacy vintages.
For Business Operators & Borrowers
The financing environment has tightened in both price and structure. New borrowers should expect spreads of S+475 to S+525 bps on senior secured facilities, with all-in yields in the 8.5%–9.5% range depending on sector and sponsor quality. Covenants are returning: maintenance-based FCCR tests (typically set at 1.10x–1.25x with a 10%–15% cushion) and leverage caps are being reintroduced on new transactions, after years of cov-lite documentation dominance. VRC confirms that direct lending market conditions stabilized in Q2 2026 following Q1 volatility, with lending activity remaining competitive for higher-quality deals, implying that borrowers with strong cash flow visibility, low leverage, and non-cyclical revenue profiles can still access favorable execution.
Operators in software and technology-adjacent sectors face the most constrained environment, with lenders demanding meaningful spread premiums, stricter documentation, and lower leverage attachment points. Borrowers in healthcare, infrastructure-linked services, and asset-intensive businesses with hard collateral benefit from the structural rotation underway in lender preferences.
Forward-Looking View: Q4 2026 and Into 2027
The VRC Q2 2026 report characterizes private markets as “stabilizing but increasingly selective.” That framing captures the outlook well. Several dynamics will shape the next six months:
- Rate path rigidity: Forward curve expectations remain broadly flat, with higher-for-longer dynamics persisting through at least H1 2027. Floating-rate private credit borrowers cannot plan around near-term base rate relief.
- M&A-driven deal flow recovery: Middle market PE deal value increased approximately 10.7% year-over-year and exit activity rose 14% in Q2 2026, signaling gradual normalization. A recovery in sponsor-driven M&A is the primary lever for direct lending deal volume recovery.
- ABF and specialty finance as structural permanent fixtures: With Intelligence notes that specialty finance was the most popular strategy for new private credit fund launches in 2025 (84 new funds vs. 71 for direct lending), and its share of total private credit fundraising rose from 5% in 2023 to over a third of new fund activity. This structural shift will not reverse.
- Manager consolidation pressure: PwC’s 2026 Private Credit Survey identifies that rising compliance costs, fee compression, and operational complexity are “pushing the industry towards a future with fewer, but larger, managers,” with scale becoming a requirement, not merely an advantage.
- Regulatory scrutiny intensifying: The FSB’s May 2026 vulnerability report, the Fed’s formal queries to major banks about private credit exposure, and JPMorgan CEO Jamie Dimon’s warning about private credit losses being “higher than expected” all signal a new regulatory chapter is opening. Expect enhanced disclosure requirements and potentially higher capital charges on bank financing to private credit funds.
Key Market Insights for Bond Capital Clients
- 📌 Spreads have re-widened to S+500: Middle market direct lending spreads are 50–100 bps wider than late 2025, representing the most favorable entry point for new loan originations since 2022. Lenders deploying fresh capital today benefit from improved yield, stronger covenants, and lower leverage. (Hamilton Lane; Lord Abbett)
- 📌 FCCR and ICR are recovering but remain thin: U.S. middle market FCCR sits at 1.3x and ICR at 1.9x as of Q1 2026, improved from 2024 lows but with minimal headroom. Borrowers operating below 1.25x FCCR face covenant risk in any renewed revenue softness. (Dancap / Lincoln International / BlackRock)
- 📌 Default disambiguation is essential: Fitch’s record 6.0% LTM private credit default rate (April 2026) includes distressed exchanges. The “true” picture depends entirely on methodology. Allocators must demand standardized default reporting from managers: including distressed exchanges, maturity extensions, and PIK conversions. (CNBC / Fitch; Forbes / Moody’s)
- 📌 Capital is rotating structurally, not cyclically: The decline of direct lending from 58% to 31% of private credit fundraising in just over one year reflects a durable structural shift toward ABF, infrastructure debt, and specialty finance. Operators seeking financing through traditional cash-flow-based structures face a smaller and more selective pool of competing lenders. (Wellington / PitchBook; The Credit Crunch H1 2026)
- 📌 Vintage risk is the portfolio time bomb: 2021–2022 vintage loans (underwritten at peak leverage and low rates) are now seasoned, over-levered by ~0.9x relative to underwriting, and approaching maturity. Refinancing activity for this cohort will be the defining credit risk event of 2027. Operators with exposure to this vintage should proactively engage lenders on liability management options now. (VRC Q2 2026; Investing.com / Cliffwater)


