
Underwriting & Risk Management | Bond Capital
EBITDA Adjustments and Normalization: The Credit Underwriter’s Framework for Stripping Noise from Earnings
Published: September 6, 2026
The Underwriting Challenge
A sponsor presents a $10M manufacturing company with $2.1M in Reported EBITDA and a management-prepared Adjusted EBITDA schedule that reaches $3.4M, a 62% premium over reported earnings, after adding back $680K in "one-time" restructuring costs, $420K in excess owner compensation, and $300K attributed to a "non-recurring" ERP implementation. The sponsor proposes 5.5x leverage on that $3.4M figure. The implied loan balance: $18.7M against a business whose actual, documented cash flows may support far less.
This is the EBITDA normalization problem in its most compressed form. As one practitioner framework notes, "the bridge between Reported and Adjusted EBITDA is no longer just a meme-worthy punchline, it's a red flag in the eyes of investors and diligence teams." For credit underwriters, the discipline is not philosophical; it is structural. Every dollar of unjustified add-back that flows into EBITDA inflates debt capacity, compresses covenant cushion, and silently degrades recovery in a downside scenario. The underwriter's mandate is clear: validate the earnings base before sizing the debt.
The Normalization Framework: From Reported to Bankable EBITDA
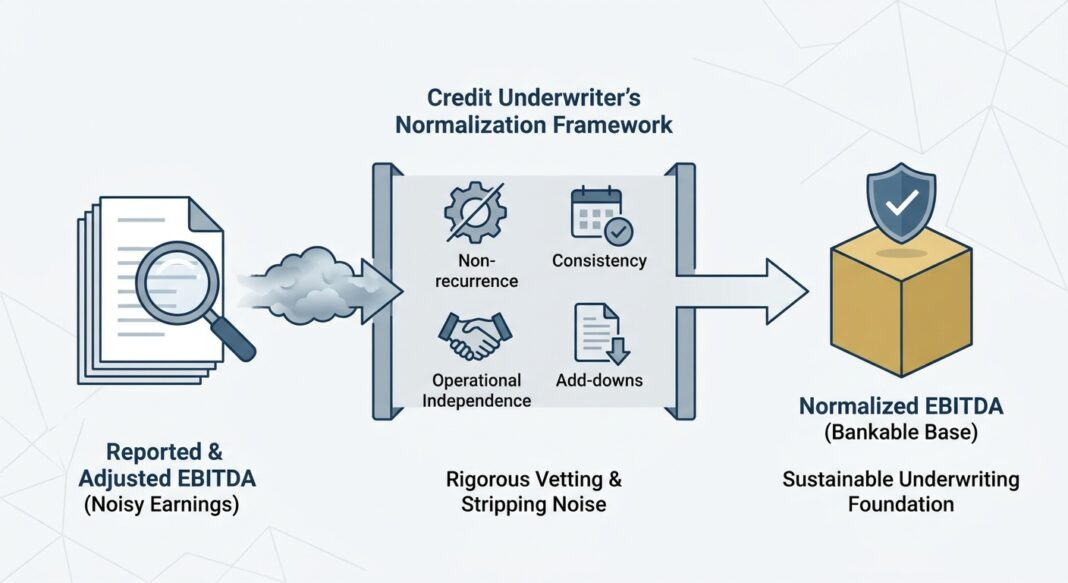
Credit underwriters operate on a simple but critical distinction: Adjusted EBITDA is what management presents; Normalized EBITDA is what the lender can sustainably underwrite. These are not the same number, and experienced lenders treat seller-provided schedules as a starting point, not a conclusion.
A rigorous normalization framework moves through four layers:
Layer 1: Start with Audited Financials
Reported EBITDA drawn from audited or reviewed financial statements is the only defensible baseline. LTM (Last Twelve Months) EBITDA derived from trailing quarterly data is the standard measurement period for credit sizing. Run-rate EBITDA, which extrapolates current performance into future periods, requires much higher evidentiary support before a lender accepts it as the underwriting base.
Layer 2: Evaluate Each Add-Back Against Four Tests
Each management add-back must survive four underwriter questions before receiving credit:
- Traceability: Can the adjustment be traced to an invoice, payroll record, or GL entry?
- Non-recurrence: Is this expense genuinely one-time, or does it recur under a different label each year?
- Operational independence: Would this cost truly disappear under new ownership, or is it being relabeled?
- Consistency: Is the adjustment methodology consistent period-over-period?
Anticipated cost savings, synergies dependent on post-closing actions, and implemented price increases without invoice support are typically rejected or heavily haircut. Owner compensation adjustments are accepted only after deducting the market cost of replacing the owner's functional role.
Layer 3: Apply Normalization Add-Downs
A credible EBITDA schedule includes both add-backs and add-downs. If a business benefits from below-market related-party rent, the lender must normalize rent to market, which reduces EBITDA. If the founder has been drawing a below-market salary, the replacement management cost reduces EBITDA. Lenders who skip add-downs are performing valuation theater, not credit underwriting.
Layer 4: Arrive at Lender-Underwritten Normalized EBITDA
The output is a single, documented figure, the "bankable" EBITDA, that feeds into leverage sizing, debt service coverage calculation, and covenant setting. This is the number the deal lives or dies on.
Example: $10M Manufacturing Company
| Line Item | Management Adjusted | Lender Normalized |
|---|---|---|
| Reported EBITDA | $2,100,000 | $2,100,000 |
| Restructuring costs (add-back) | +$680,000 | +$340,000 (50% haircut, 3rd consecutive year) |
| Excess owner compensation | +$420,000 | +$175,000 (net of $245K market replacement cost) |
| ERP implementation | +$300,000 | $0 (recurring capex cycle) |
| Below-market related-party rent (add-down) | $0 | -$120,000 |
| Final EBITDA | $3,400,000 | $2,495,000 |
At 5.5x leverage, management's schedule implies $18.7M in debt capacity. The lender's normalized figure supports $13.7M: a $5M difference that changes the entire deal structure, equity requirement, and covenant cushion.
The Analysis: Walking Through Leverage and Coverage
Once Normalized EBITDA is established, the underwriter applies it to the two metrics that govern credit sizing: the Total Leverage Ratio (Net Debt ÷ EBITDA) and the Debt Service Coverage Ratio (DSCR).
Total Leverage Ratio
Using the example above at $13.7M in debt against $2.495M in Normalized EBITDA, total leverage sits at approximately 5.49x, a meaningful stretch for a sub-$10M EBITDA manufacturing company. Most direct lenders in the middle market target entry leverage between 4.0x and 5.5x for senior secured positions, with tighter constraints applied to cyclical industries.
Debt Service Coverage Ratio (DSCR)
DSCR measures available cash flow against total debt service (principal amortization + cash interest). Assuming a 7-year term loan at 9.5% with 5% annual amortization:
- Annual interest: ~$1.30M
- Annual principal amortization: ~$685K
- Total debt service: ~$1.985M
- DSCR = $2.495M ÷ $1.985M = 1.26x
A 1.26x DSCR on a volatile manufacturing business is thin. Most institutional lenders require a minimum 1.20x-1.35x at origination, with the understanding that a 15-20% EBITDA decline immediately stresses coverage into breach territory. This is where stress testing becomes non-negotiable.
Stress Scenario
Apply a -20% revenue stress (consistent with a moderate demand contraction or tariff-related input cost spike) and Normalized EBITDA falls to approximately $1.996M. DSCR drops to 1.01x. The business is one missed quarter from a covenant trigger. This is precisely the kind of scenario that gets obscured when the underwriting EBITDA is inflated with unsupported add-backs.
Industry Standards and Credit Performance Data
Understanding where the market sits on defaults, recoveries, and covenant behavior is essential context for calibrating underwriting discipline.
Private Credit Performance Benchmarks
📊 Data Box: Default & Loss Rates, Private Credit (2025-2026)
- Cliffwater CDLI 20-Year Avg. Annual Credit Loss Rate (2004-2024): 1.01% across ~21,000 loans totaling $549B in assets. This figure uses a loss-rate methodology, meaning a loan that defaults but recovers at 90 cents contributes only 10 cents of loss, not a full default count. (Source: Cliffwater / Angel Investors Network, 2026)
- Cliffwater CDLI Broader Index Estimated Annual Loss (2017-2025): ~1.47%, reflecting both senior and non-senior middle market loans. (Source: Morgan Stanley Investment Management, 2026)
- CDLI Q2 2025 Credit Losses: 0.75% annually, well-controlled even amid market volatility. (Source: Cliffwater via Larry Swedroe, 2025)
- Fitch Private Credit Default Rate (2025): 9.2%, a headline figure using a default-count methodology that counts every event regardless of recovery outcome. (Source: Fitch via Angel Investors Network, 2026)
- Moody's High-Yield Bond Default Rate (Mid-2025): 5.8% including distressed restructurings; 2.1% excluding them. Leveraged loan default rate projected at 7.5% year-end 2025, remaining near that level through Q1 2026. (Source: Moody's Credit Strategy US Review, July 2025)
- U.S. Private Credit Defaults (Q2 2025): 5.5%, up from 4.5% in Q1, reflecting rising stress in privately placed corporate debt. (Source: CoinLaw / Institutional data compilation, 2026)
Note: Divergent default rate figures across sources reflect fundamental differences in methodology, loss-rate vs. default-count, and borrower universe. Underwriters should anchor to the metric most consistent with their own portfolio loss accounting framework.
Red Flags and Common Underwriting Mistakes
Practitioners and institutional analysts have identified a consistent set of failure patterns in EBITDA-based underwriting:
- Recurring "non-recurring" costs: Restructuring charges that appear in three consecutive periods are not non-recurring. Lenders who continue to add them back are systematically overstating EBITDA.
- Synergy inflation: Add-backs that rely on post-closing cost savings or buyer-driven synergies do not belong in seller-normalized EBITDA. The business should receive credit only for earnings it can support before closing.
- Run-rate extrapolation without documentation: Implemented price increases receive add-back credit only when invoice and customer retention data confirm they are already in the run rate, not management projections of future pricing power.
- Omitting add-downs: Below-market related-party arrangements (rent, management fees, intercompany services) must be normalized to market rates, even if this reduces EBITDA. Lenders who skip this step accept a structurally flawed earnings base.
- Covenant cushion compression: In stress testing, even a modest EBITDA decline in a highly leveraged structure can eliminate covenant headroom almost entirely. Middle market lenders operating near 5.0x leverage need to model downside scenarios rigorously, given that macro and sector shocks can cascade quickly.
Underwriting Checklist: EBITDA Normalization Due Diligence
The following checklist represents minimum documentation and analytical standards for EBITDA normalization in a middle market credit underwrite:
Documentation Requirements
- ✅ Three years of audited or reviewed financial statements (GAAP basis)
- ✅ LTM income statement bridged to most recent quarterly close
- ✅ Complete management-prepared add-back schedule with GL support
- ✅ Supporting invoices or payroll records for each add-back > $25K
- ✅ Related-party transaction schedule with independent market comparables
- ✅ Owner compensation benchmarked to third-party replacement cost data
- ✅ Evidence of implemented (not projected) price increases: customer invoices + retention data
Analytical Steps
- ✅ Apply four-test filter (traceable, non-recurring, operationally independent, consistent) to every add-back
- ✅ Identify and apply all normalization add-downs (related-party rent, below-market compensation)
- ✅ Calculate LTM, prior two-year average, and three-year average EBITDA, compare for trend analysis
- ✅ Document delta between management Adjusted EBITDA and Lender Normalized EBITDA
- ✅ Recalculate total leverage ratio and DSCR on Lender Normalized EBITDA
- ✅ Run base case, -10% EBITDA, and -20% EBITDA stress scenarios
- ✅ Confirm covenant headroom under each stress scenario
Questions to Ask Management
- ✅ Have any of the add-backed costs appeared in any prior-year period? If yes, why are they non-recurring?
- ✅ What is the market rate for the functions currently performed by the owner?
- ✅ Are any projected cost savings dependent on post-closing actions or new management?
- ✅ What is the business's actual maintenance capex requirement, separate from growth capex?
Key Takeaways
- 📌 Treat every add-back as guilty until proven innocent. Seller-provided adjustment schedules are a starting point. Independent verification against source documents is the only standard that holds up in a workout.
- 📌 Add-downs are not optional. Below-market related-party economics inflate EBITDA as surely as overstated add-backs. A credible normalization schedule runs in both directions.
- 📌 The delta between Adjusted and Normalized EBITDA is a risk signal. A gap of more than 15-20% between management's figure and the lender's figure warrants deal-level re-evaluation, not just a covenant adjustment.
- 📌 Stress test from the normalized base, not the adjusted one. Running downside scenarios against an inflated EBITDA figure produces false comfort. A -20% shock should be modeled against the lender's conservative underwriting number.
- 📌 Loss rates and default rates are not the same metric. The Cliffwater CDLI's 20-year average annual credit loss rate of 1.01% and Fitch's 9.2% 2025 default rate describe different realities. Disciplined origination, senior security, and rigorous normalization are the variables that close the gap between a high default count and a low realized loss.


