
The Underwriting Question That Defines Every Deal
A sponsor sends you a Confidential Information Memorandum on a $10M EBITDA manufacturing company. The management-prepared Adjusted EBITDA schedule runs four pages. By the time you reach the bottom, $2.8M of the headline number is composed of add-backs: restructuring charges, one-time consulting fees, a CEO transition cost, a “COVID-era freight anomaly,” and projected cost savings from a system migration that hasn’t started yet. The leverage ratio looks clean at 4.9x. Strip out the questionable adjustments and you’re staring at 6.7x on true normalized earnings.
This is the central challenge of modern credit underwriting. EBITDA adjustments and normalization are the most consequential (and most frequently manipulated) step in the entire credit analysis process. Get this wrong and every downstream metric (leverage, coverage, debt capacity, and covenant headroom) is built on a false foundation.
Institutional lenders increasingly recognize the risk. IOSCO has formally acknowledged that “EBITDA marketed by borrowers may significantly underestimate leverage at deal inception due to inappropriate EBITDA adjustments,” a concern that has rippled from the broadly syndicated loan market into private credit. A May 2026 Financial Stability Board report on private credit vulnerabilities noted that the “true leverage in private credit could be closer to 7x debt-to-EBITDA” once aggressive adjustments are properly scrutinized. The discipline begins with the underwriter.
The Framework: Four-Layer EBITDA Reconstruction
Sophisticated credit underwriters do not start with management’s Adjusted EBITDA; they end there as a check. The correct process begins with audited or reviewed financial statements and moves through four distinct layers of analysis:
Layer 1: Baseline EBITDA (Reported)
Start with net income from the most recent trailing twelve months (TTM) and add back interest expense, income taxes, depreciation, and amortization. This is your clean starting point: unmanipulated, auditable, and defensible. For our $10M EBITDA manufacturing example, let’s assume reported EBITDA is $7.2M before any adjustments.
Layer 2: Normalization Adjustments (Owner-Specific & Non-Recurring)
These are the adjustments most lenders will accept, provided they are documented and traceable. They include:
- Above-market owner compensation: The owner pays himself $950K. A market-rate replacement costs $550K. Add back $400K, but only after benchmarking against industry data.
- Verified one-time legal costs: A $180K litigation settlement from a resolved, non-recurring matter. Accept if the underlying dispute is closed. Add back $180K.
- Transaction-related expenses: $95K in M&A advisory fees directly tied to the current sale process. Accept. Add back $95K.
Running total after Layer 2: $7.875M
Layer 3: Contested Adjustments (Require Independent Verification)
This layer demands the most scrutiny. Common contested items include claimed “run-rate” cost savings, revenue from contracts signed but not yet generating cash, and cyclical freight or input cost anomalies. Each requires documentary proof (invoices, signed contracts, third-party vendor quotes) before receiving any credit. Adjustments based on anticipated post-closing actions should receive zero credit at underwriting. As one practitioner framework puts it: “Anticipated cost savings may be rejected if they depend on post-closing actions.”
Layer 4: Add-Downs (Underwriter-Initiated Reductions)
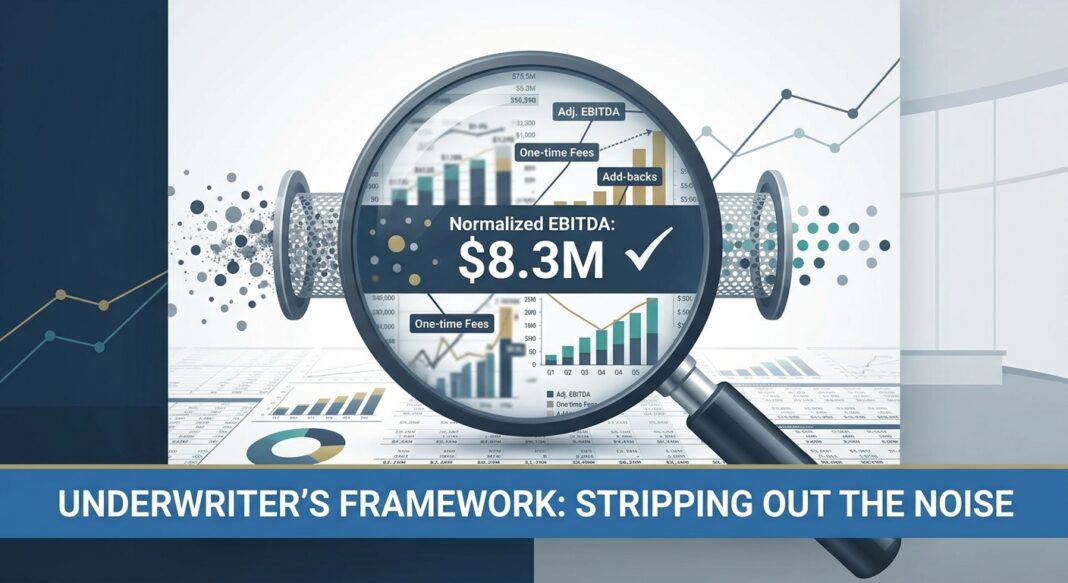
This is what separates a lender from a cheerleader. If the business has below-market rent from a related party that a buyer will need to normalize upward, or if owner labor is significantly underpaid relative to a market replacement, the underwriter must reduce EBITDA accordingly. A credible normalization analysis applies both add-backs and add-downs. Underwriting-adjusted EBITDA for the example: $8.3M (management claimed $10.0M).
The Analysis: Walking Through the Numbers
With underwriter-normalized EBITDA of $8.3M, the analysis of the proposed $49M unitranche facility looks materially different than management presented:
| Metric | Management View | Underwriter View | Verdict |
|---|---|---|---|
| Adjusted EBITDA | $10.0M | $8.3M | ↓ 17% |
| Total Debt / EBITDA | 4.9x | 5.9x | Elevated Risk |
| DSCR (TTM) | 1.41x | 1.17x | Below 1.25x Floor |
| Interest Coverage (EBITDA / Interest) | 2.5x | 2.1x | Tight but Passing |
The DSCR calculation is critical. Most commercial and middle market lenders establish minimum DSCR covenants of no less than 1.25x: the point at which a borrower can service total debt (principal plus interest) with a meaningful cushion against earnings volatility. At 1.17x on normalized figures, this borrower fails at underwriting entry, before any stress scenario is applied.
Stress Test: Two-Scenario Analysis
Applying a disciplined stress framework informed by market benchmarks:
- Adverse Case (rates flat, EBITDA -10%): Normalized EBITDA drops to $7.47M. DSCR falls to 1.05x. Leverage rises to 6.6x. Covenant breach is near-certain. Per ABF Journal stress-testing analysis, an adverse scenario with -10% EBITDA compression pushes roughly 25% of middle market firms below 1.0x coverage.
- Severe Case (EBITDA -20%): Normalized EBITDA at $6.64M. DSCR collapses to 0.93x. The borrower cannot service debt from operations. Default probability rises sharply.
The conclusion is clear: the deal as structured requires either a lower purchase price, reduced debt quantum, or substantial reunderwriting of the EBITDA base before a credit-disciplined lender should proceed.
Industry Standards: What Institutional Lenders Require
The regulatory and institutional landscape for EBITDA scrutiny has sharpened considerably. While the OCC and FDIC rescinded the 2013 Interagency Leveraged Lending Guidance in December 2025, removing its prescriptive 6.0x Total Debt/EBITDA threshold, this does not mean leverage discipline has disappeared. That guidance had for over a decade established a de facto leverage ceiling: as the 2014 FAQs were interpreted by supervisors, “transactions with total debt-to-EBITDA levels above 6.00x would raise concern.” Banks are now expected to manage leveraged lending through their own tailored risk frameworks aligned with safety and soundness principles.
Private credit lenders, for their part, continue to rely heavily on financial maintenance covenants. Unlike broadly syndicated loan markets, “private credit lenders rely on contractual protections to monitor performance, manage risk and preserve value,” and “leverage-based maintenance testing continues to anchor the vast majority of private credit structures.” The leverage ratio remains the primary covenant, with DSCR and interest coverage as secondary triggers.
📊 Credit Performance Data Box
- U.S. Private Credit Default Rate: Rose to 5.5% in Q2 2025, up from 4.5% in Q1 2025, reflecting mounting stress in privately placed corporate debt. (Source: CoinLaw / Market Aggregation of Moody’s & BofA data)
- High-Yield Bond Default Rate: S&P reported a trailing 12-month high-yield default rate above 4% through September 2025, near the long-term average of ~4.5%, with a forecast of 4.25% by June 2026. (Source: S&P Global Ratings via Valuation Research Corp.)
- Lower Middle Market Stress: KBRA forecast the lower middle market default rate reaching 3% by year-end 2025, reversing prior improvement trends and exceeding the projected overall U.S. direct lending default rate. (Source: Valuation Research Corp.)
- EBITDA Projection Miss Rate: S&P’s research found that 97% of speculative-grade companies that announced acquisitions in 2019 fell short of their first-year earnings forecasts, underscoring the chronic unreliability of sponsor-provided EBITDA projections. (Source: S&P Global Ratings via Bloomberg)
- Private Credit True Leverage: An FSB analysis published in May 2026 noted that once EBITDA add-back adjustments are scrutinized, “true leverage in private credit could be closer to 7x debt-to-EBITDA,” significantly above reported figures. (Source: FSB Report on Vulnerabilities in Private Credit, May 2026)
Common Red Flags in EBITDA Schedules
- Recurring “one-time” charges: If restructuring or legal costs appear in two or more consecutive years, they are not one-time. Label them as ongoing operating friction and zero them out of the add-back.
- Forward-looking cost savings without evidence: System migrations, headcount reductions, and vendor renegotiations that haven’t been executed carry zero underwriting credit until they hit the income statement.
- Large add-back-to-EBITDA ratios: When add-backs exceed 20–25% of reported EBITDA, lenders should apply heightened skepticism. Covenant Review data showed add-backs accounting for approximately 28% of total adjusted EBITDA figures in marketed acquisition loans by 2019.
- Run-rate revenue from unsigned contracts: Revenue not yet contracted cannot be normalized into the earnings base.
- Missing add-downs: Any schedule that presents only add-backs and no downward adjustments is almost certainly optimistic.
EBITDA Normalization Underwriting Checklist
Use this step-by-step diligence framework on every deal before accepting any EBITDA figure:
- Obtain audited or reviewed financials for a minimum of three fiscal years plus the current TTM/LTM period. Reconcile all periods before evaluating any management schedules.
- Build your own EBITDA bridge independently from net income up, do not start from management’s adjusted figure and work backward. Independence matters.
- Categorize every add-back into: (a) Accepted, fully documented and non-recurring; (b) Haircut, partially supported or uncertain magnitude; (c) Rejected, forward-looking, recurring, or undocumented.
- Request source documentation for every line item exceeding $50K: board minutes, third-party invoices, separation agreements, rent schedules, and payroll records.
- Benchmark owner compensation against industry-specific executive comp surveys (BDO, Mercer, or sector-specific databases). Apply a replacement cost, not the owner’s actual draw.
- Stress test normalized EBITDA across at least three scenarios (base, adverse at -10%, severe at -20%) and calculate DSCR, leverage, and coverage ratios in each.
- Validate DSCR against the 1.25x floor. If the normalized DSCR in the base case falls below 1.25x, escalate before proceeding to credit committee.
- Check for add-down exposures: Related-party lease pricing, below-market management fees, underpaid key person compensation, and deferred capital expenditure obligations.
- Cross-reference cash flow statements to verify that EBITDA flows to free cash flow at a reasonable conversion rate (typically 60–80% for healthy middle market companies). Persistent divergence is a signal of earnings quality problems.
- Document your underwriter-adjusted EBITDA with a clear, annotated bridge that can be presented to credit committee and revisited during portfolio monitoring.
Key Takeaways for Credit Underwriters
- 🎯 Treat the seller’s EBITDA as a starting point, never a conclusion. Lenders independently rebuild earnings from audited financials, management schedules inform the analysis but do not define it.
- 🚨 Add-backs exceeding 20–25% of reported EBITDA are a structural red flag. Large adjustment ratios correlate strongly with earnings misses post-close, as documented by S&P’s multi-year analysis of speculative-grade acquisition performance.
- 📈 DSCR below 1.25x on normalized figures is a hard stop in base case underwriting. Stress scenarios at -10% and -20% EBITDA compression must also be modeled before credit committee submission.
- ⚠️ The withdrawal of prescriptive leveraged lending guidance does not reduce underwriting responsibility. Banks and private credit lenders are expected to apply rigorous, tailored risk frameworks, if anything, the removal of a regulatory floor places greater burden on internal credit discipline.
- 📋 True leverage in private credit is frequently understated. FSB research published in May 2026 suggests that after proper scrutiny of EBITDA adjustments, effective leverage in private credit portfolios may be significantly higher than reported, making EBITDA normalization one of the highest-leverage activities in portfolio risk management.


