
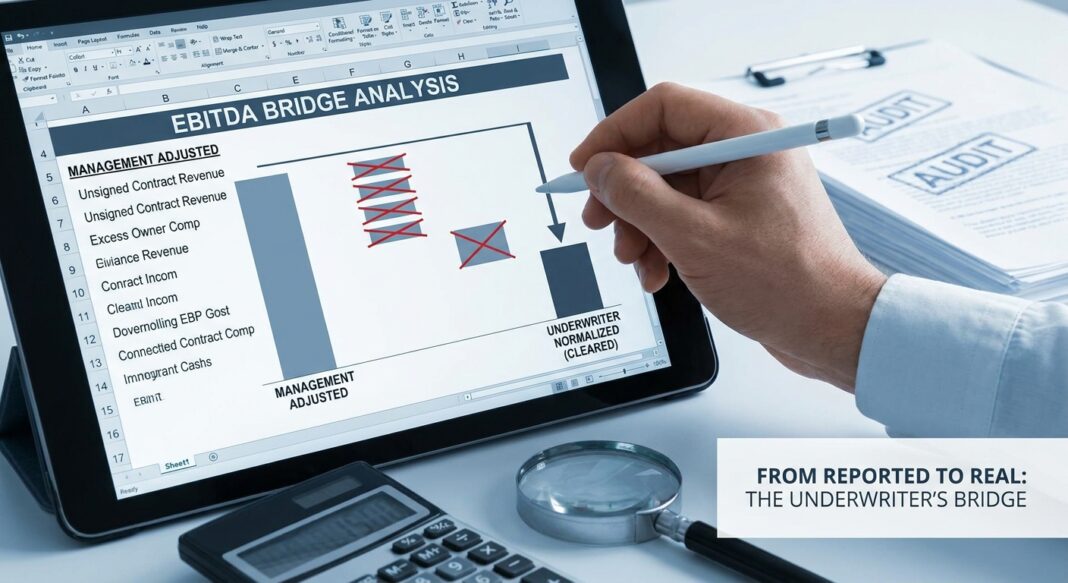
The Underwriting Question That Decides Everything
Before a credit committee approves a term sheet, one question sits at the center of every private credit deal: How much of this EBITDA is real? It is a deceptively simple question with structurally complex answers. A borrower’s management team presents a Confidential Information Memorandum showing $10 million in Adjusted EBITDA. The deal is priced at 5.5x leverage, implying $55 million of total debt. The fixed charge coverage ratio appears comfortable at 1.35x. On paper, the credit looks clean.
But the EBITDA figure sitting at the center of those calculations is not an accounting output; it is a negotiated construct. It starts with reported earnings and then layers in a bridge of add-backs: restructuring charges, one-time consulting fees, management bonuses above market, Covid-era government grants, anticipated cost synergies, and projected revenue from contracts not yet signed. Each adjustment travels through a valuation multiple. At 5.5x, a single questionable $500,000 add-back inflates enterprise value by $2.75 million and makes the borrower appear $2.75 million less leveraged than they actually are.
Disciplined underwriters do not take the seller’s earnings bridge at face value. They rebuild it from the ground up. This article explains how.
The Framework: From Reported to Underwriter-Cleared EBITDA
The goal of EBITDA normalization in credit underwriting is to arrive at a sustainable, lender-cleared earnings figure that reflects what the business will actually generate to service debt: not what it generated under optimal, owner-specific, or non-recurring conditions. This is distinct from the seller’s adjusted EBITDA, which is constructed to maximize valuation.
As practitioners describe it, Adjusted EBITDA removes one-time and non-operating items from reported earnings, while Normalized EBITDA goes further, incorporating the steady-state cost structure the business will require post-closing, including market-rate management compensation and necessary capital reinvestment. Normalized EBITDA can and often does come in lower than the seller’s adjusted figure.
The underwriter’s EBITDA bridge follows a structured, sequential process:
- Anchor to tax returns and audited financials. Management-prepared P&Ls and broker CIMs are starting points, not conclusions. Lenders independently assess adjustments against source documents: tax returns, bank statements, payroll records, and general ledger detail.
- Test every add-back for recurrence. The core underwriting question for each adjustment: Would this cost disappear (or necessarily change) under new ownership? Items that recur even if labeled “non-recurring” stay in the expense base.
- Replace owner compensation with market-rate cost. Excess owner compensation is a legitimate add-back only to the extent it exceeds the market cost of replacing that owner’s operating function. The replacement cost goes back in.
- Eliminate forward-looking and synergy-based add-backs. Anticipated cost savings dependent on post-closing actions, unapproved price increases, and speculative synergies are not lender-creditworthy earnings. They belong in the equity upside case, not the debt underwriting base.
- Normalize working capital and related-party economics. Below-market rent on related-party leases, inter-company management fees, and irregular working capital patterns all require normalization to reflect post-close economic reality.
Example: A $10M EBITDA Industrial Services Company
Management presents $10.2M in Adjusted EBITDA for a specialty industrial services business. The underwriter’s rebuild produces the following bridge:
| Item | Management ($000s) | Underwriter ($000s) | Rationale |
|---|---|---|---|
| Reported EBITDA | $7,400 | $7,400 | Anchored to audited financials |
| + Owner excess compensation | $900 | $550 | Add-back net of $350K market replacement cost |
| + One-time legal settlement | $400 | $400 | Accepted: documented, resolved, non-recurring |
| + Restructuring / severance | $600 | $0 | Rejected, pattern of recurring restructuring charges in 3 of 4 years |
| + Pro forma cost savings | $600 | $0 | Rejected, depend on post-closing operational changes not yet implemented |
| + Related-party rent adjustment | $300 | $150 | Partially accepted at market-rate differential only |
| = Underwriter-Cleared EBITDA | $10,200 | $8,500 | $1.7M gap reduces debt capacity by ~$9.4M at 5.5x |
The $1.7 million reduction in underwriter-cleared EBITDA is not a minor rounding error. At a 5.5x leverage multiple, it translates to approximately $9.4 million less in supportable debt: a material structuring difference that directly determines loan sizing, pricing, and whether the deal is creditworthy at the proposed terms.
Walking Through the Calculations: Key Credit Metrics
Once the underwriter has established a cleared EBITDA figure, that number flows into three foundational credit metrics that drive structure and pricing decisions:
1. Total Leverage (Debt / Underwriter-Cleared EBITDA)
Using the example above: $46.75M in total debt ÷ $8.5M underwriter EBITDA = 5.5x leverage: the same ratio as proposed, but on a smaller debt quantum. If management’s $10.2M figure had been used without challenge, leverage would have appeared artificially lower at 4.6x, misrepresenting the true risk profile by nearly a full turn.
2. Fixed Charge Coverage Ratio (FCCR)
FCCR = (Underwriter EBITDA − Cash Taxes − Unfinanced CapEx) ÷ (Debt Service). Using $8.5M EBITDA, $400K taxes, $750K maintenance CapEx, and $6.2M annual debt service: FCCR = ($8.5M − $0.4M − $0.75M) ÷ $6.2M = 1.19x. This is materially below the 1.35x management-implied coverage, and below many institutional lenders’ minimum covenant threshold of 1.20x.
3. Stress Test: Downside EBITDA Scenario
Experienced lenders apply a downside scenario, typically a 20–25% EBITDA contraction, to test whether debt service can be maintained through a cycle. At a 20% stress: $8.5M × 0.80 = $6.8M stressed EBITDA. FCCR drops to ($6.8M − $0.4M − $0.75M) ÷ $6.2M = 0.91x: a sub-1.0x coverage that would trigger covenant breach in most credit agreements. This stress outcome is not an edge case; it is a design criterion for proper loan sizing and covenant structuring.
What Institutional Lenders Are Seeing in the Market
The discipline of EBITDA normalization has taken on heightened urgency in the current private credit environment. Market-wide data from rating agencies and direct lenders reveals a credit landscape where inflated earnings assumptions have material consequences:
- Private credit default rates are rising, with concentration in smaller issuers. According to Fitch Ratings, the U.S. private credit default rate reached 9.2% in its Privately Monitored Ratings portfolio for 2025, up from 8.1% in 2024, with the highest default incidence among borrowers with EBITDA of $25 million or less.
- Distressed exchanges now dominate default statistics, masking underlying stress. Moody’s analysis indicates that the private credit default rate in 2025 ranged between 1.6% and 4.7%, depending on whether distressed exchanges are included, and that distressed restructurings accounted for approximately 65% of all defaults in 2025. This means headline default rates understate latent credit deterioration at the borrower level.
- Selective defaults outpaced conventional defaults by a 5:1 ratio in 2024, driven by flexible covenant structures and payment-in-kind conversions, according to S&P Global analysis of private credit markets.
- Credit committee behavior has shifted measurably. After looser add-back documentation became pervasive in 2020–2021, lenders pushed back on caps, windows, and evidence standards as rates rose through 2023–2024. Credit committees now flag deals where a high percentage of EBITDA is derived from run-rate or non-cash add-backs, treating that dependence as a credit risk factor rather than a structural feature.
- Add-back gaps reprice deals materially. According to GF Data/ACG’s Fall 2025 middle-market study, deals backed by a formal Quality of Earnings process close at a median 7.4x TEV/EBITDA versus 7.0x without, confirming that earnings credibility carries a quantifiable premium, and that undocumented add-backs carry a symmetrical discount when challenged.
📊 Credit Data Box: EBITDA Add-Back Risk Indicators (2025–2026)
- 1.6%–4.7%: Estimated private credit direct lending default rate range for 2025, depending on inclusion of distressed exchanges (Moody’s, May 2026)
- 9.2%: U.S. private credit default rate in Fitch’s Privately Monitored Ratings universe, 2025, up from 8.1% in 2024 (Securitas Global / Fitch, 2026)
- 65%: Share of all 2025 corporate defaults that were distressed exchanges, not hard defaults (Moody’s, 2026)
- 20%–30%: Typical reported-to-adjusted EBITDA gap in lower middle-market transactions; gaps wider than 30% signal aggressive add-backs that buyers will challenge in QoE (Iconic / IBBA, 2026)
- 5–15%: Typical deal repricing range when material QoE findings are identified during diligence; extreme cases reach 30%+ or deal termination
- 76%: Share of lower middle-market valuations using recast/adjusted EBITDA as the primary multiple basis (Pepperdine 2025 Private Capital Markets Report)
The Underwriting Checklist: EBITDA Normalization Diligence
The following framework represents the minimum documentation and analytical standards that a disciplined private credit underwriter should apply before clearing any EBITDA figure for credit committee presentation:
Phase 1: Document Anchoring
- ☐ Obtain 3 years of federal tax returns; reconcile net income to management-prepared P&Ls
- ☐ Pull 12–24 months of bank statements; validate revenue and payroll outflows against reported figures
- ☐ Request general ledger detail for any add-back line item exceeding $100,000
- ☐ Confirm audit or review status of financial statements; flag compilations as elevated risk
Phase 2: Add-Back Challenge Protocol
- ☐ For each add-back, apply the recurrence test: has this cost appeared in more than one of the prior three fiscal years?
- ☐ For owner compensation adjustments, document the market replacement cost benchmark (use BLS Occupational Wage Data or comparable job postings); net the add-back accordingly
- ☐ Reject any pro forma synergy or cost savings that requires post-closing action not yet completed or contracted
- ☐ Evaluate related-party lease or management fee adjustments against third-party market comparables; accept only the differential
- ☐ For SaaS or tech borrowers: assess stock-based compensation add-backs carefully; consider requiring dual EBITDA presentation (with and without SBC)
- ☐ For healthcare or services borrowers: scrutinize bad debt provisions, compliance remediation, and provider taxes; these tend to recur regardless of labeling
Phase 3: Metric Construction and Stress Testing
- ☐ Build underwriter-cleared EBITDA; document the bridge from management figure with accepted and rejected items
- ☐ Calculate Total Leverage (Debt / Cleared EBITDA), FCCR, and Interest Coverage on cleared figures
- ☐ Run a 20% and 30% downside stress on cleared EBITDA; confirm FCCR floor and covenant headroom at each stress level
- ☐ Ask: At what EBITDA level does debt service coverage fall below 1.0x? That is your maximum supportable add-back exposure.
Phase 4: Documentation for Credit Committee
- ☐ Present a side-by-side table: management EBITDA vs. underwriter-cleared EBITDA with itemized variance explanation
- ☐ Flag any add-backs that could not be fully documented and quantify their credit impact
- ☐ State the deal’s underwriting sensitivity: how many turns of leverage does each $1M of contested add-backs represent?
Key Takeaways for Credit Practitioners
- EBITDA is underwritten, not accepted. Seller-provided normalization schedules are a starting point. The underwriter’s job is to independently verify, challenge, and rebuild the earnings base from primary source documents, not to negotiate with the borrower’s banker toward a mutually convenient number.
- Every rejected add-back reduces supportable debt capacity. At a 5.5x multiple, each $1M of disallowed add-backs removes $5.5M from maximum loan sizing. Understanding this arithmetic is the foundation of disciplined leverage underwriting.
- The FCCR is your stress-test anchor. A borrower showing 1.35x coverage on management EBITDA may show sub-1.0x coverage on underwriter-cleared figures. Build your covenant structure (and your maximum hold limit) around the stressed, cleared figure, not the headline number.
- Distressed exchange prevalence is a warning to lenders, not a comfort. The fact that 65% of 2025 private credit defaults were restructurings rather than hard payment defaults does not mean credit quality is strong; it means borrowers are rolling distress forward. Lenders who underwrote on inflated EBITDA are now managing those workouts, not exiting them.
- Documentation discipline is your legal and commercial protection. A well-constructed EBITDA normalization workbook (with source documents, challenge rationale, and credit committee sign-off) is not just underwriting best practice. It is the defensible record that determines lender remedies if a borrower’s performance deteriorates post-close.


