
Underwriting & Risk Management
EBITDA Adjustments & Normalization: The Credit Underwriter's Most Dangerous Variable
August 19, 2026 • Bond Capital Editorial Desk
The Underwriting Challenge
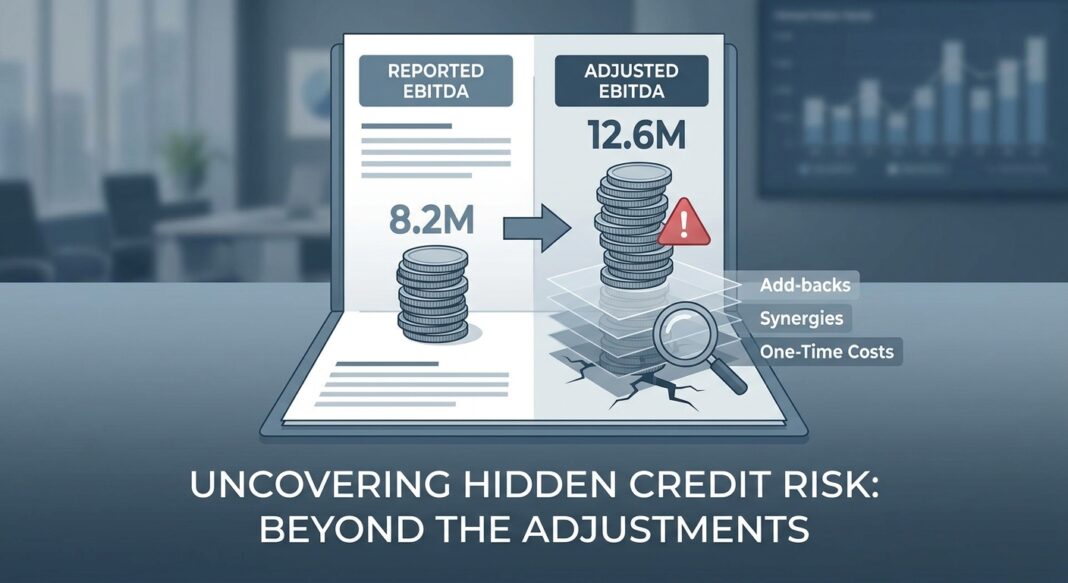
You are reviewing a Confidential Information Memorandum for a sponsor-backed manufacturing business. Reported EBITDA from audited financials: $8.2 million. Adjusted EBITDA from the sponsor's model: $12.6 million. The delta ($4.4 million, or roughly 54% of reported earnings) sits in a three-page add-back schedule. The proposed debt package is structured at 5.5x adjusted EBITDA. If half those adjustments are rejected during diligence, true leverage swells past 8x.
This is not a contrived scenario. It is the defining tension of modern credit underwriting. Adjusted EBITDA (the metric that drives leverage ratios, covenant headroom, debt capacity, and pricing) is also the most negotiated, most manipulated, and most misunderstood figure in any credit package. Getting it wrong does not just affect a single deal; it infects the portfolio risk model that all subsequent monitoring decisions rely on.
The job of an underwriter is not to accept the seller's earnings bridge. It is to independently build one, then stress it. This article teaches you exactly how.
The Analytical Framework: Adjusted vs. Normalized EBITDA
Practitioners often conflate two distinct concepts that demand separate treatment in the credit file:
- Adjusted EBITDA: Reported EBITDA restated to remove one-time, non-recurring, or non-operating items. This is the seller's first offer.
- Normalized EBITDA: Goes further: reflecting the sustainable earnings a new owner can realistically underwrite, after accounting for steady-state staffing costs, market-rate compensation, mandatory reinvestment, and the removal of owner-specific economics that will not survive a change of control.
The distinction matters enormously. Normalized EBITDA can be lower than adjusted EBITDA when the business requires additional costs under new ownership: a replacement CFO, a market-rate lease, or a lost key-man revenue stream. Lenders who underwrite solely off the seller's adjusted figure, without independently normalizing, routinely inherit risk that is invisible at origination but catastrophic at default.
The Five Categories of Add-Backs
A disciplined lender classifies every proposed adjustment into one of five buckets before assigning credit:
- Clearly Acceptable: Documented one-time transaction costs, resolved legal settlements with no ongoing exposure, non-cash stock-based compensation with proper disclosure.
- Conditionally Acceptable: Owner compensation above market replacement cost, only after deducting the verified cost of replacing the owner's operating role at arms-length rates.
- Evidence-Dependent: Implemented price increases or cost reductions: only if invoices, vendor contracts, and customer retention data confirm the change is already in the trailing twelve-month run rate.
- Rejected Until Closed: Anticipated post-closing synergies or cost savings that depend on management actions not yet taken. These belong in the sponsor's upside model, not the lender's underwriting EBITDA.
- Flagged for Haircut: Any run-rate adjustment where the expected benefit exceeds 10–15% of reported EBITDA and lacks third-party validation. Underwriting proceeds on a haircut basis, and covenants are set on the lower figure.
Example: $10M EBITDA Manufacturing Company
Reported EBITDA: $10.0M
Sponsor add-back, one-time litigation settlement (documented): +$0.6M ✓
Sponsor add-back, excess owner salary vs. market replacement: +$0.8M ✓ (conditional)
Sponsor add-back, synergies from planned plant consolidation: +$1.2M ✗ (rejected)
Sponsor add-back, non-cash rent concession (expiring in 6 months): +$0.4M ✗ (rejected)
Lender's Normalized EBITDA: $11.4M (vs. sponsor's $13.0M)
At 5.5x leverage, lender underwrites $62.7M debt capacity vs. sponsor's $71.5M, a $8.8M structural difference.
The Analysis: Walking Through Calculations and Red Flags
Step 1: Build the Independent EBITDA Bridge
Start from audited or reviewed financials. Never start from the sponsor's model. Construct your own three-year income statement bridge, line by line, mapping each proposed adjustment to a source document: tax return, bank statement, vendor contract, payroll record, or legal resolution letter. Any adjustment that cannot be traced to a source document is disallowed pending further evidence.
Step 2: Calculate the Add-Back Concentration Ratio
Divide total proposed add-backs by reported EBITDA. Industry practitioners use a threshold rule: if more than 25% of EBITDA derives from run-rate savings and non-cash add-backs, independent validation and tighter caps should be required. If validation is unavailable, haircut the underwriting EBITDA before setting covenants. Credit committees at major direct lenders now flag deals where this ratio is elevated, treating add-back concentration as a credit risk in its own right, not merely a financial engineering question.
Step 3: Calculate Your Coverage and Leverage Ratios on Normalized EBITDA
Three ratios govern the credit decision, all computed on the lender's independently normalized EBITDA:
- Total Debt / Normalized EBITDA (Leverage Ratio): U.S. federal banking guidance has historically limited leveraged loans to 6.0x debt-to-EBITDA. Direct lenders operating outside bank constraints may extend unitranche facilities at 6.0x–7.0x, but only with maintenance covenants and tighter add-back caps that banks rarely require.
- Fixed Charge Coverage Ratio (FCCR): (Normalized EBITDA − Cash Taxes − Maintenance CapEx − Required Distributions) ÷ (Cash Interest + Scheduled Principal). Minimum institutional threshold: 1.10x–1.25x at origination. Payment-in-kind (PIK) interest must be watched carefully, PIK exclusions from the FCCR denominator can keep the ratio intact while true leverage quietly compounds.
- Debt Service Coverage Ratio (DSCR): Similar to FCCR but applied to total debt service. Overly aggressive normalization can produce an acceptable DSCR on paper that fails the moment add-backs fail to materialize, one of the most common reasons sponsor-backed deals trip covenants within 18 months of close.
Step 4: Stress Test the Normalized Figure
Apply three scenarios: (1) Base Case: normalized EBITDA holds flat; (2) Stress Case: normalize downward by 15–20% to simulate revenue softening or add-back non-realization; (3) Break-Even: calculate the minimum EBITDA at which the borrower can still service debt. If the stress case EBITDA falls below break-even, the structure requires reconsideration: either through reduced leverage, additional equity, or enhanced covenant protection.
Industry Standards: What Institutional Lenders Require
The private credit market has experienced a measurable shift in underwriting discipline following the rate cycle of 2022–2024. As rates rose, lenders pushed back hard on caps, time windows, and evidence standards for add-backs, reversing the permissiveness of the 2020–2021 liquidity wave. The consequences of that era's loose underwriting are now visible in the default data.
📊 Credit Performance Data Box
- The U.S. leveraged loan default rate reached a decade-high of 5.6% in late 2024, surpassing the pandemic peak of 4.5% in 2020, driven largely by distressed exchanges. (Fitch Ratings / FTI Consulting, 2025 Leveraged Loan Market Survey)
- Moody's projects the high-yield bond default rate at 3.2% for 2025, rising above 4% by Q1 2026, still below the 4.5% historical average since 1996 but trending upward. (Moody's US Credit Review & Outlook, July 2025)
- For leveraged loan issuers specifically, Moody's projects the default rate to reach 7.5% by year-end 2025: nearly double the 3.4% historical average. (Moody's, July 2025)
- First-lien recovery rates have deteriorated sharply: Fitch reports the par-weighted average first-lien recovery fell to 39% in 2024, down from 51% in 2023 and 76% in 2022, driven by liability management transactions, loan-only capital structures, and asset-light borrowers. (Fitch Ratings, via Alternative Credit Investor, April 2025)
- Moody's estimates expected ultimate recoveries on U.S. first-lien loans at roughly 68% on a long-run basis, meaningfully below the historical high-70s average, reflecting structural shifts toward top-heavy capital structures. (CLO Recovery Rate Database, citing Moody's Ultimate Recovery Database, 2026)
- 93% of private credit loans include caps on EBITDA add-backs for run-rate synergies, and 99% carry at least one financial maintenance covenant, underscoring the covenant discipline that differentiates private credit from broadly syndicated, cov-lite loan markets. (Proskauer Private Credit Insights Report, via JD Supra)
Common Red Flags Experienced Lenders Watch For
- The Recurring "One-Time" Charge: If the trailing three years show restructuring or legal charges in every period, they are recurring costs, not add-backs. Relabeling ongoing costs as non-recurring is one of the oldest games in EBITDA engineering.
- Pro Forma Synergies Without an Execution Plan: Add-backs for post-closing consolidation, headcount reductions, or procurement savings should be rejected unless the borrower can provide a detailed, time-stamped implementation schedule. Anticipated cost savings that depend on post-closing actions have no place in underwriting EBITDA.
- High Non-Cash Add-Back Concentration: When non-cash items (stock-based compensation, phantom equity costs, unrealized FX adjustments) represent a disproportionate share of normalized EBITDA, the lender's leverage ratio may look acceptable while true cash generation is structurally lower.
- Cov-Lite Risk Without the Liquidity to Match: Roughly 90% of the $1.4 trillion in outstanding U.S. leveraged loans in the Morningstar LSTA index lacked maintenance covenants as of mid-2024. Cov-lite loans have historically underperformed on recovery, averaging 70% vs. 78% for fully covenanted first-lien loans in the post-GFC period. Lenders accepting cov-lite structures should demand compensating premium and enhanced reporting triggers.
- PIK Interest Masking Coverage Deterioration: When PIK interest is excluded from FCCR calculations, coverage ratios can appear stable while true leverage compounds. Monitoring FCCR with and without PIK, on a quarterly basis, is essential for identifying deterioration early.
The EBITDA Normalization Underwriting Checklist
Use this step-by-step framework for every credit where EBITDA adjustments exceed 10% of reported earnings:
Documentation Requirements
- ☐ Obtain three years of audited (or CPA-reviewed) financial statements. Do not begin the EBITDA bridge from management accounts.
- ☐ Request a detailed add-back schedule with source document references for every line item: payroll records, lease agreements, legal settlement documents, vendor invoices.
- ☐ Obtain a Quality of Earnings (QoE) report from an independent accounting firm. Verify the scope covers revenue sustainability, working capital normalization, and customer concentration.
- ☐ Confirm that all implemented price increases or cost reductions cited as add-backs are demonstrably in the trailing twelve-month run rate, with invoicing data and customer retention evidence.
- ☐ Validate owner compensation add-backs against market replacement costs using comparable public comp data or an independent compensation analysis.
Questions to Ask Before Accepting Any Add-Back
- ☐ Can this adjustment be traced directly to a third-party source document?
- ☐ Has this "one-time" item appeared in prior periods? If so, it is recurring.
- ☐ Does this benefit require post-closing management action to be realized? If yes, reject it from underwriting EBITDA.
- ☐ What is the add-back concentration ratio? Does any single add-back represent more than 10–15% of reported EBITDA?
- ☐ If all projection-based add-backs are removed, does the leverage ratio still clear the credit policy threshold?
- ☐ Have covenants been set on the lender's normalized EBITDA, not the sponsor's adjusted figure?
Post-Close Monitoring Triggers
- ☐ Establish quarterly tracking: realized cost savings vs. the plan supporting each run-rate add-back.
- ☐ Set a realization deadline, if more than 50% of projected run-rate savings are not in the reported financials within nine months of close, require updated management plans and initiate covenant reset discussions.
- ☐ Monitor FCCR with and without PIK interest on every quarterly compliance certificate.
Key Takeaways
- 🔹 The seller's adjusted EBITDA is a starting point, not a conclusion. Independent lender normalization (built from audited financials, not management models) is the only defensible basis for setting leverage, covenants, and debt capacity.
- 🔹 Add-back concentration is a credit risk, not just a structuring nuance. When run-rate and non-cash add-backs exceed 25% of reported EBITDA, require independent validation or haircut underwriting EBITDA before covenant-setting, regardless of sponsor pressure.
- 🔹 Recovery rates are no longer your backstop. First-lien recoveries fell to 39% in 2024, less than half their 2022 level. In a deteriorating recovery environment, origination discipline on EBITDA normalization is the primary loss-prevention tool available to direct lenders.
- 🔹 PIK interest and cov-lite structures can mask deterioration for multiple reporting periods. Lenders must build independent monitoring frameworks (tracking true cash coverage and leverage trajectory) rather than relying solely on contractual compliance certificates driven by potentially inflated covenant EBITDA.
- 🔹 Post-close realization tracking is non-negotiable. Add-backs that are accepted at origination must be tracked against actual realized outcomes quarterly. If synergies and run-rate savings fail to materialize within the first nine months, that is a leading indicator of covenant stress, and should trigger a proactive lender conversation before a formal breach.


