
Market Headline: A Lender-Friendly Reset Takes Hold, But Fault Lines Are Deepening
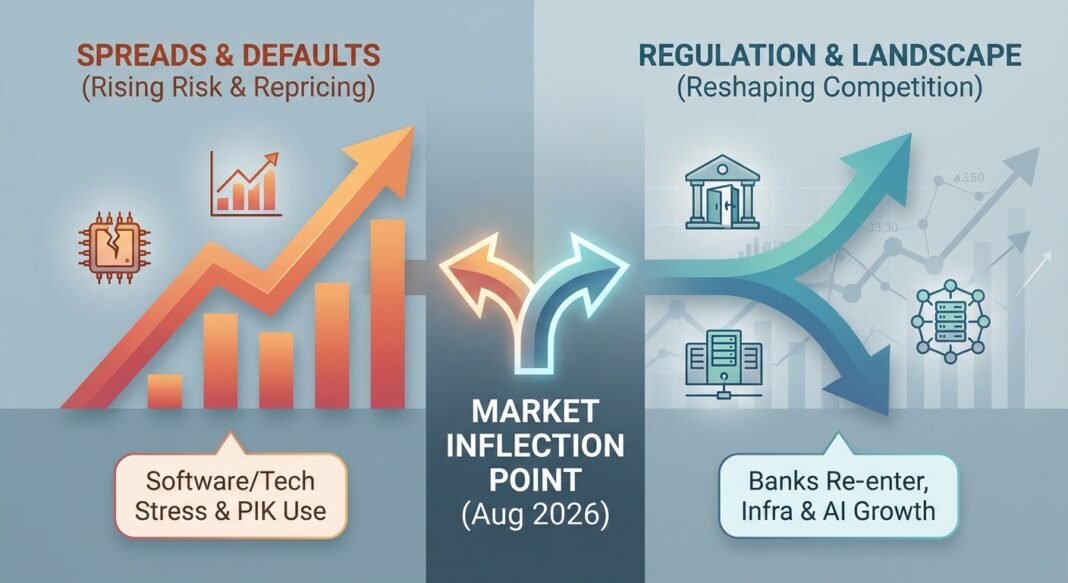
Private credit markets in August 2026 are operating in a fundamentally different environment than 12 months ago. Three converging forces have recalibrated the risk-reward calculus for every participant in the capital stack: a meaningful repricing of credit risk upward, a non-linear default cycle concentrated in software and AI-adjacent sectors, and a regulatory deregulatory pivot that is beginning to restore banks as meaningful competitors in leveraged lending.
The headline data tells a story of guarded opportunity. Spreads have widened by roughly 50 to 100 basis points since late 2025, while defensive terms have also improved, according to PitchBook. At the same time, lenders describe a market reset taking shape, with spreads widening, leverage pulling back, and deal terms improving: on plain-vanilla deals, spreads have moved out roughly 25 to 50 basis points, meaning a loan that priced at S+450 late last year would likely come at S+500 today, with slightly more OID.
But the repricing is not uniform. Performance remains notably weaker in the software sector, where secondary spreads are approximately 245 basis points wider than year-end levels and roughly 229 basis points above the broader B-rated loan index, based on PitchBook LCD data as of June 19, 2026, reflecting continued uncertainty related to AI-driven disruption. That bifurcation (between competitively priced vanilla credits and deeply distressed tech-sector paper) defines the current cycle’s key operational challenge for both lenders and borrowers.
Macro conditions remain a headwind. Three-month Term SOFR stands at approximately 3.68%, with five-year U.S. Treasury yields at approximately 4.23% in June, up from 3.92% in March, as market expectations continue to reflect a higher-for-longer rate environment with the forward curve broadly flat as of June 2026.
Quantitative Market Snapshot
The table below synthesizes the most current available data points across key credit market metrics. All figures are sourced from institutional research and regulatory publications as cited.
| Metric | Current Value (Q2 / Aug 2026) | Prior Period | Change | Source |
|---|---|---|---|---|
| Middle Market Direct Lending Spread (plain-vanilla unitranche) | S+500 bps (avg. S+509 on recent LBOs) | S+450–474 bps (Q4 2025 / Q1 2026) | +25 to +50 bps | PitchBook LCD, Q2 2026 Wrap |
| Software Sector Secondary Spread Premium vs. B-Rated Loan Index | ~+229 bps above broader B-rated loan index | Broadly in line at year-end 2025 | ~+245 bps wider YTD | Valuation Research Corp., Q2 2026 |
| 3-Month Term SOFR | 3.68% | 3.67% (Q1 2026) | +1 bp QoQ | Valuation Research Corp., Q2 2026 |
| 5-Year U.S. Treasury Yield | ~4.23% (June 2026) | 3.92% (March 2026) | +31 bps QoQ | Valuation Research Corp., Q2 2026 |
| Private Credit Default Rate (Proskauer Index, senior secured & unitranche) | 2.51% (Q2 2026; 716 loans / $195.6B) | 2.73% (Q1 2026); 2.46% (Q4 2025) | -22 bps QoQ; still +67 bps vs. Q3 2025 | Proskauer Private Credit Default Index, July 28, 2026 |
| Fitch U.S. Private Credit Default Rate (broader methodology) | 6.0% trailing-12-month (May 2026) | 5.8% (Jan 2026) | Elevated; PIK-driven | Valuation Research Corp. / Fitch, Q2 2026 |
| HY Bond OAS (ICE BofA US HY Index) | ~2.70–2.80% (early-to-mid July 2026 range) | ~3.16% (early 2026 high) | Compressed ~46 bps from YTD peak | Bankers Edge Advisory, Aug. 4, 2026 |
| Private Credit Premium Over Public High Yield | ~150–200 bps (compressed from ~350 bps in 2019) | ~350 bps (2019) | Structurally compressed | Owners.PE, April 2026 |
| U.S. PE Deal Count (H1 2026 vs. H2 2025) | 3,999 transactions (H1 2026) | 4,619 transactions (H2 2025) | -13.5% HoH | CohnReznick / PitchBook, Mid-Year 2026 |
| BDC Net % Tightening, C&I Loans to Large & Mid-Market Firms (SLOOS) | 8.1% (Q2 2026) | Tighter in Q1 2026 | Stabilizing; net tightening persists at margin | Federal Reserve FRED / SLOOS, Q2 2026 |
Data sourced from publicly available institutional research, regulatory filings, and index providers as of the dates noted. All-in yields reflect base rate plus applicable spread.
The interest coverage picture has shown tentative improvement: the underlying corporate borrower’s interest coverage ratio (EBITDA/interest) improved year-over-year due to lower interest rates and some EBITDA growth. Crucially, however, loan-to-value ratios remain conservative across segments, stable LTVs indicating lenders have not materially loosened underwriting standards in the last three years, allowing for a significant first-loss capital cushion should credit markets deteriorate.
On the regulatory front, a landmark shift is now in motion. On December 5, 2025, the OCC and FDIC rescinded guidance on leveraged lending activities by banks, a development that should allow banks to better apply enterprise-wide risk management programs to this type of lending and potentially create additional competition in the private credit loan market. OCC and FDIC examiners will continue to evaluate underwriting, risk ratings, and loan-loss reserves, but without reference to numerical leverage thresholds or prescriptive repayment metrics.
Sector Analysis: Where Capital Is Flowing, and Where It Is Fleeing
🔴 Software & Enterprise Technology: The Cycle’s Epicenter
Software remains the single most consequential fault line in private credit. Strategists at Morgan Stanley note that defaults are concentrated in software, which constitutes a significant portion of private credit, the sector had been supported by alternative asset managers for a decade due to perceived reliable revenue streams, but emerging AI disruptions have cast doubt on this stability. In the leveraged loan market specifically, a record $25 billion of software-sector loans now trade below the distress threshold of 80 cents on the dollar, according to Morningstar LSTA data, software holds a 13% market share in the leveraged loan index, but 13% of those loans are now marked at distressed levels.
The structural problem is one of collateral erosion: software EBITDA multiples have collapsed from 30x at the end of 2022 to roughly 16x, with revenue multiples falling from 10–12x to about 4x, effectively cutting the collateral value of many loans in half. Lenders are responding with repricing and selectivity. Morgan Stanley analysts warned that default rates in direct lending could climb to 8% as AI disruption continually disrupts the software industry, with elevated leverage and looming maturity walls within the software sector potentially pushing default rates toward peak levels unseen since the pandemic.
PIK (payment-in-kind) activity is masking the depth of distress. Fitch Ratings found the true U.S. private credit default rate reached 5.8% for the twelve months through January 2026, the highest since Fitch began tracking the figure, with 60% of those defaults involving interest payment deferrals or conversion to payment-in-kind arrangements.
🟢 Healthcare: Resilient Favorite, but Non-Accruals Watch
According to Octus Data, healthcare led the way for private credit in 2025, accounting for 19% of all direct lending deals. In healthcare, demographic shifts and non-cyclical service models continue to attract lenders seeking stable cash flows. Lenders should nonetheless note that Morgan Stanley maintains a significant underweight to healthcare, which has led all sectors in loans placed on non-accrual status over the last year. Sub-sector selection within healthcare (differentiating between physician practice management, pharma services, and medical devices) is now a core underwriting discipline.
🟢 Infrastructure & AI Data Centers: The New Growth Frontier
In infrastructure, private credit is being used to fund large-scale projects, such as renewable energy developments, that require significant capital investment. The AI infrastructure supercycle is creating a distinct origination opportunity: according to a Reuters analysis of the AI-driven data center boom, Morgan Stanley estimates private credit could supply more than half the $1.5 trillion needed for global data center buildouts through 2028. Private credit has been leading the development of financing structures for large-scale AI-related infrastructure.
🟡 Lower and Core Middle Market: Differentiated, Less Contested
As of Q1 2026, only 39% of upper middle market issuers (over $100M EBITDA) were unique to a single portfolio, compared to 80% of lower middle market issuers (under $40M EBITDA), per Cliffwater, making the lower and core middle market less concentrated and offering access to a broader and more differentiated set of issuers. Despite softening private credit sentiment, the lower and core middle market continue to offer a differentiated and less competitive opportunity set.
🟡 Energy-Intensive Industrials: Underwriting Tightened by Geopolitical Risk
Lenders have responded by tightening underwriting standards for energy-intensive industries and businesses whose leverage was predicated on stable energy costs, and will continue to watch oil prices and factor movements into deals with heavy exposure over the next several quarters.
Implications: What These Dynamics Mean for Borrowers and Lenders
For Borrowers and Operators
The repricing cycle has meaningfully shifted negotiating leverage toward lenders, particularly below the upper middle market. M&A activity is creating more opportunities to lend; capital has become more selective; spreads are wider; covenants and documentation are improving; and managers with dry powder can be more selective about the credits they choose to finance. Borrowers in sectors with AI-disruption exposure (software, tech-enabled services) face materially higher pricing and stricter documentation requirements than credits in infrastructure, healthcare services, or defense-adjacent industrials.
The KPI bar has risen. Lenders are placing greater emphasis on free cash flow generation and FCCR coverage. Investors are increasingly focused on where managers are lending, how loans are structured, how much free cash flow borrowers generate, and whether portfolios have the right balance of income, downside mitigation, and selectivity. Operators should expect lenders to stress-test FCCR at both current SOFR (3.68%) and a 50–100 bps increase scenario, and to apply more conservative EBITDA adjustments, particularly add-backs related to cost savings or integration synergies not yet realized.
For borrowers with near-term maturities, the picture has improved at the margin. As of June 30, just 15% of debt investments held by BDCs were due in 2026 and 2027, down from 20% at year-end 2024, representing $68.1 billion at cost, underscoring the progress borrowers have made in reducing their near-term maturity wall.
For Institutional Investors and Lenders
The lender-friendly reset creates real opportunity, but demands managerial discipline and portfolio differentiation. More deal flow and wider spreads are constructive, but the most durable advantage may come from better documentation, more conservative leverage, and the time to conduct stress analysis before capital is deployed.
The regulatory deregulatory shift carries dual implications. Banks re-entering the upper middle market as competitors will compress spreads on larger, cleaner credits. Banks have gradually returned to the market in Q2 2026, contributing to increased competition in the upper middle market and alleviating some upward pressure on credit spreads. For private credit managers, this migration of banks upmarket creates a relative opportunity in the core and lower middle market, precisely where issuer uniqueness and pricing power are highest.
Investors must also grapple with the growing divergence between reported and economic default rates. Official default rates of 1–2% are misleading; broader methodologies suggest the true rate is 5.8% and rising, with many defaults hidden by payment-in-kind arrangements, as 40% of borrowers have negative free cash flow. Allocators should examine vintage exposure carefully: non-accruals, PIK usage, sector concentration, and 2021–2022 vintage exposure should remain important indicators, with greater differentiation already visible in portfolios with exposure to older vintages and more aggressively financed software-related credits.
On the capital structure side, capital is increasingly shifting toward specialist strategies, including asset-backed finance, non-sponsor lending, and the selective use of leverage, with managers often accepting greater complexity and risk as they enact this shift.
Forward-Looking View: Liquidity and Lending Dynamics, Next 3–6 Months
The second half of 2026 is likely to be defined by dispersion. The dominant themes shaping H2 2026 lending dynamics are:
- Spread Stabilization in Core Middle Market: With banks re-entering the upper market and private credit dry powder still ample, conditions in the direct lending market stabilized during Q2 following the volatility of March, with lending activity remaining competitive, particularly for higher-quality deals.
- Continued Pressure on Software Vintages: Increased defaults in the software sector over the coming years are anticipated as 2022-vintage loans near maturity and require refinancing.
- Secondary Market Maturation: Market turmoil and liquidity pressures prompted private credit managers to list more loans for sale in a secondary capacity than ever before, with some trading at par but others at discounts ranging from 3 cents to over 10 cents below par. This nascent secondary market is becoming a critical liquidity valve and a real-time price discovery mechanism.
- Regulatory Scrutiny Intensifying: The SEC has opened several inquiries into large private credit managers, with the Treasury Department also looking into their business models. The Treasury Department has assembled a dedicated team to assess insurer exposure and plans to convene meetings with state insurance regulators on emerging risks.
- M&A Pipeline as Catalyst: Several structural opportunities are creating pathways for sponsors willing to act decisively: AI-enabled value creation, growing demand for infrastructure-related assets, expansion of middle-market private credit, and continued fragmentation across service sectors.
Key Market Insights: 5 Actionable Takeaways
- Spreads have reset to S+500 on plain-vanilla credits: the first meaningful lender-friendly pricing shift since mid-2023. Managers deploying capital today are locking in structurally better risk-adjusted entry points, with covenants and documentation also improving. Prioritize new origination over secondary exposure in higher-quality segments.
- Software sector exposure must be actively stress-tested. With secondary spreads 245 bps wider YTD, EBITDA multiples halved from 2022 peaks, and Morgan Stanley projecting an 8% default rate, any portfolio with material 2020–2022 vintage software concentration warrants immediate reassessment of FCCR, PIK usage, and collateral coverage.
- The OCC/FDIC leveraged lending guidance rescission is a structural market shift, not a one-time event. Banks re-entering upper middle market leveraged lending will compress spreads on large-cap, plain-vanilla credits, but create a relative opportunity gap in the core and lower middle market, where private credit retains pricing power and origination exclusivity.
- The gap between reported and economic defaults is material. Fitch’s 6.0% trailing-12-month rate versus Proskauer’s 2.51% reflects the widespread use of PIK mechanics that defer, not resolve, credit distress. Investors should audit PIK balances as a percentage of portfolio income and treat elevated PIK as a leading indicator of future impairment.
- Infrastructure and AI-adjacent debt are the cycle’s clearest structural growth opportunities. With Morgan Stanley estimating private credit could fund over half of a $1.5 trillion data center buildout through 2028, and European Basel IV implementation set to push more lending to private funds, infrastructure-linked credit is positioned as the highest-conviction growth allocation for H2 2026 and beyond.


