
The Deal Structure That Ate the Middle Market
If you have spent any time around private equity sponsors or middle-market M&A attorneys in the past decade, you have heard the word unitranche. It appears in almost every acquisition financing conversation for companies valued between $25 million and $200 million. It is cited as the reason deals close faster, why borrowers deal with fewer lenders, and why private credit platforms have displaced banks in a wide swath of the leveraged loan market.
But the term is routinely misunderstood, by borrowers who assume it is cheaper, and by investors who assume it is safer. Neither is automatically true. Understanding what a unitranche actually is, how risk is allocated inside it, and what it costs in today’s market is foundational knowledge for anyone operating in or evaluating private credit. This article teaches the mechanics from the ground up and connects them to current pricing and structural data as of mid-2026.
What Is a Unitranche? The Mechanism Defined
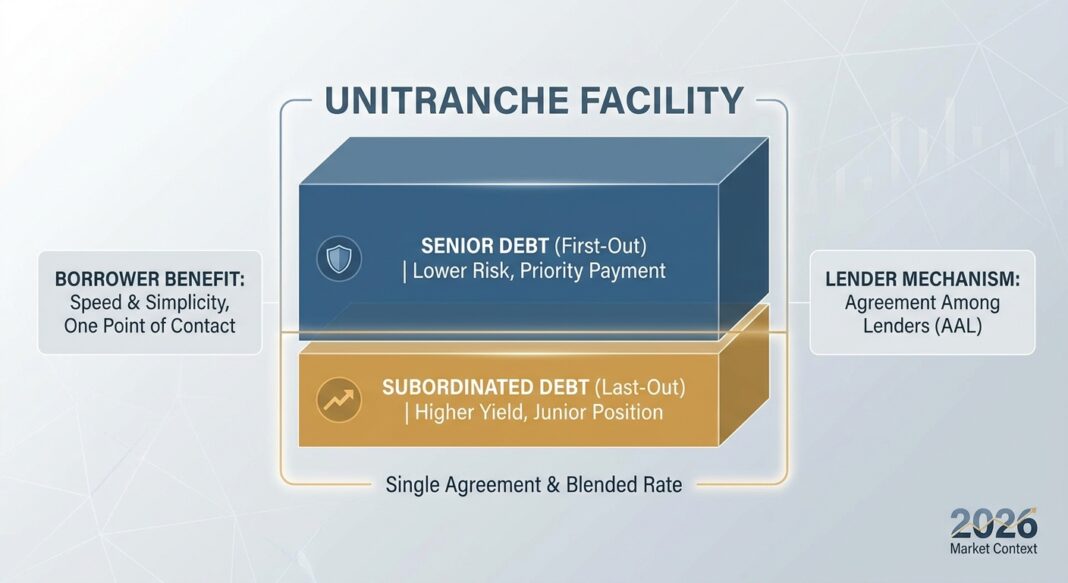
A unitranche is a single secured credit facility that blends senior and subordinated debt into one loan agreement, one set of covenants, and one blended interest rate. The borrower sees a single lender relationship: one credit agreement, one closing, one point of contact post-close. That simplicity is the product’s core value proposition.
Behind the scenes, however, the structure is more layered. According to Mayer Brown (July 2026), a unitranche facility typically involves two or more lender groups sharing the same security interest on the borrower’s collateral, while agreeing privately among themselves on payment priority. This private arrangement, called an Agreement Among Lenders (AAL): divides the single loan into a first-out piece (lower risk, lower yield) and a last-out piece (higher risk, higher yield). The borrower never sees this split. From the borrower’s perspective, there is simply one loan.
The first-out lender receives principal repayment priority and accepts a lower spread in exchange for reduced loss exposure. The last-out lender accepts repayment subordination and demands a significantly higher spread to compensate, in some cases SOFR + 850 basis points or more, according to AlternativeFortune (July 2026). In a fund context, whether the portfolio is weighted toward first-out or last-out exposure is one of the most important risk questions an investor can ask.
How It Works: A Concrete Example with Real Numbers
Consider a private equity sponsor acquiring a specialty services business with $10 million in EBITDA at a purchase multiple of 7x, implying a $70 million enterprise value. The sponsor contributes $25 million in equity and needs $45 million in debt financing. Here is how two structures compare:
Traditional Structure (Pre-Unitranche Era):
- Senior Bank Term Loan: $30M at SOFR + 275 bps (all-in ~6.4%)
- Mezzanine Debt: $15M at a fixed rate of 13–15%
- Two separate credit agreements, two sets of covenants, two lender groups to manage, and an intercreditor agreement between them
- Timeline to close: 90–120 days typical
Unitranche Structure (2026 Market):
- Single Unitranche Facility: $45M at SOFR + 525 bps (all-in ~9.2% with Term SOFR at ~3.69%)
- One credit agreement, one covenant package, one lender to manage
- Timeline to close: 30–45 days typical
- Total leverage: 4.5x EBITDA, well within the 4x–6x range that defines the lower middle market
The blended unitranche rate sits between what the senior and mezzanine tranches would have cost separately. The borrower pays a modest all-in premium versus a senior-only bank loan, but gains speed, simplicity, and execution certainty: attributes that are often worth more than the incremental basis points, especially in competitive auction processes where closing speed can determine whether a deal is won or lost.
The lender, in turn, is pricing a single instrument to reflect the risk of both the first-lien senior and the junior exposure embedded within it. That blended pricing is not accidental; it compensates for the last-out exposure that lives inside the AAL.
Current Market Conditions: What the Data Says in 2026
The unitranche market has repriced materially from its 2021–2022 lows and its 2023 peak. Understanding where pricing and terms sit today is essential context for both borrowers evaluating financing options and investors underwriting returns.
Unitranche Yields and Spreads: According to Valuation Research Corporation (Q2 2026), unitranche all-in yields currently range between approximately 9.00% and 9.75%, down roughly 250 basis points from peak levels of 11.5%–12.5% in late 2023, but remaining above the pre-2022 historical range of 7%–8%. Coupon spreads for standard transactions currently range from SOFR + 475 bps to SOFR + 550 bps, approximately 25 basis points higher than year-end 2025 levels.
Premium Over Syndicated Market: Per AlternativeFortune (July 2026), lower-middle-market direct lending spreads run at approximately SOFR + 450 to 475 bps, representing a 100–150 basis point premium over the broadly syndicated loan market. This spread premium reflects the illiquidity premium and the embedded subordinated risk, not inferior credit quality.
Market Dominance: According to CT Acquisitions (May 2026), unitranche structures currently account for 70–80% of acquisition financings in the $25M–$200M enterprise value range, cementing their position as the default structure for lower and core middle-market buyouts.
Bank Lending Standards, The Structural Tailwind: The Federal Reserve’s July 2026 SLOOS confirms that C&I lending standards at banks remain essentially unchanged for large and middle-market firms, though demand from large firms has strengthened. Critically, the April 2026 SLOOS showed banks tightening standards across all categories of loans to non-depository financial institutions (NDFIs), including business credit intermediaries, signaling that bank capital flowing into the private credit ecosystem faces more friction even as bank capital flowing directly to middle-market borrowers remains constrained by regulatory capital requirements and relationship bandwidth.
Performance Benchmark: According to Cliffwater (March 31, 2026), the Cliffwater Direct Lending Index (CDLI) returned 9.3% for calendar year 2025, with interest income of 10.4% serving as the primary return driver. The index has now delivered a 20-year average of 9.5% with only one negative year (2008).
Asset Class Scale: Per CT Acquisitions (July 2026), U.S. private credit has crossed $2 trillion in assets under management, with the five largest managers (Apollo, Ares, Blackstone, Carlyle, and KKR) collectively managing $1.5 trillion in perpetual capital, roughly 40% of their combined AUM.
| Metric | Current Level | Source |
|---|---|---|
| Unitranche all-in yield (US) | ~9.00% – 9.75% | VRC, Q2 2026 |
| Coupon spread range | SOFR + 475 – 550 bps | VRC, Q2 2026 |
| Term SOFR (3-month, June 2026) | 3.69% | VRC, Q2 2026 |
| Premium vs. syndicated loans | +100 – 150 bps | AlternativeFortune, July 2026 |
| CDLI 2025 annual return | 9.3% | Cliffwater, March 2026 |
| Share of mid-market deals using unitranche | 70 – 80% | CT Acquisitions, May 2026 |
Decision Framework: Investors and Operators
For Investors Evaluating Private Credit Funds
When a private credit fund describes its portfolio as unitranche, that single word conceals significant variation in risk profile. Investors evaluating these vehicles consider the following questions:
- First-out or last-out concentration? A fund with heavy last-out exposure carries meaningfully different loss characteristics than one concentrated in first-out positions, even if both call themselves “first-lien unitranche.” Investors often request portfolio-level breakdowns of FOLO composition before committing capital.
- New-issue spread versus portfolio average? As AlternativeFortune (July 2026) notes, loans being written into a SOFR + 450 environment lock in thinner economics than those originated during the 2022–2023 peak. Investors evaluate the spread on new originations, not just the aged book.
- Covenant quality? Per Lord Abbett’s 2026 midyear outlook, covenants and documentation quality have improved in the current environment. Investors favor managers who can demonstrate tighter maintenance covenants (monthly or quarterly financial tests) that provide early warning before a borrower deteriorates.
- Leverage multiples on underlying borrowers? Per CT Acquisitions (May 2026), typical unitranche leverage runs 4x–6x EBITDA. Funds concentrated in 5.5x–6x borrowers carry less equity cushion below the debt than those concentrated in 4x–4.5x transactions.
For Business Operators and CFOs Considering Unitranche Financing
Operators evaluate unitranche financing on three dimensions relative to alternatives:
- Speed and certainty: In a competitive M&A process, the ability to present a fully underwritten, single-lender term sheet (and close in 30–45 days) often outweighs the incremental cost versus a bank club deal that may take three times as long and carry conditionality risk.
- Total cost of capital: Unitranche at 9.0%–9.75% all-in compares favorably to a blended senior + mezzanine stack where the mezzanine tranche alone may price above 13%. For operators running models, the all-in blended cost, not headline spread, is the number that matters for coverage ratios and return modeling.
- Covenant flexibility: Unlike bank facilities, unitranche structures often carry a single maintenance covenant, typically a leverage test, rather than the multi-covenant packages common in bank syndications. This operational flexibility is a meaningful structural benefit for businesses with seasonal cash flows or near-term investment cycles.
- Refinancing optionality: Unitranche loans typically carry prepayment premiums (call protection) in the first one to two years. Operators model refinancing scenarios carefully, particularly if they anticipate a meaningful EBITDA step-up that would enable a repricing into better terms.
Key Takeaways
- One loan, two risk profiles: A unitranche is a single instrument to the borrower but a split risk structure for lenders. The Agreement Among Lenders (AAL) divides the facility into first-out and last-out positions that carry materially different yields and recovery outcomes in a default scenario.
- You pay for simplicity: Unitranche spreads run 100–150 basis points above comparable broadly syndicated loans. That premium compensates for illiquidity, embedded subordinated risk, and the structural complexity the borrower is not required to manage. The borrower is buying speed and certainty, not a discount.
- Current yields remain above historical norms: At 9.00%–9.75% all-in as of Q2 2026, unitranche yields have declined from their 2023 peak but remain well above the pre-2022 range of 7%–8%, providing an attractive income premium for disciplined lenders relative to public fixed-income alternatives.
- Bank retrenchment is structural, not cyclical: The Federal Reserve’s July 2026 SLOOS confirms that C&I standards for middle-market borrowers remain effectively unchanged while bank appetite for non-depository financial institution lending has tightened, sustaining the structural gap that private credit platforms were built to fill.
- Ask the fund-level question: For investors, the most important unit of analysis is not the asset class label but the specific portfolio composition. Understanding the first-out versus last-out split, the vintage spread on new originations, and the leverage multiple distribution across the book separates informed allocation decisions from marketed ones.


