
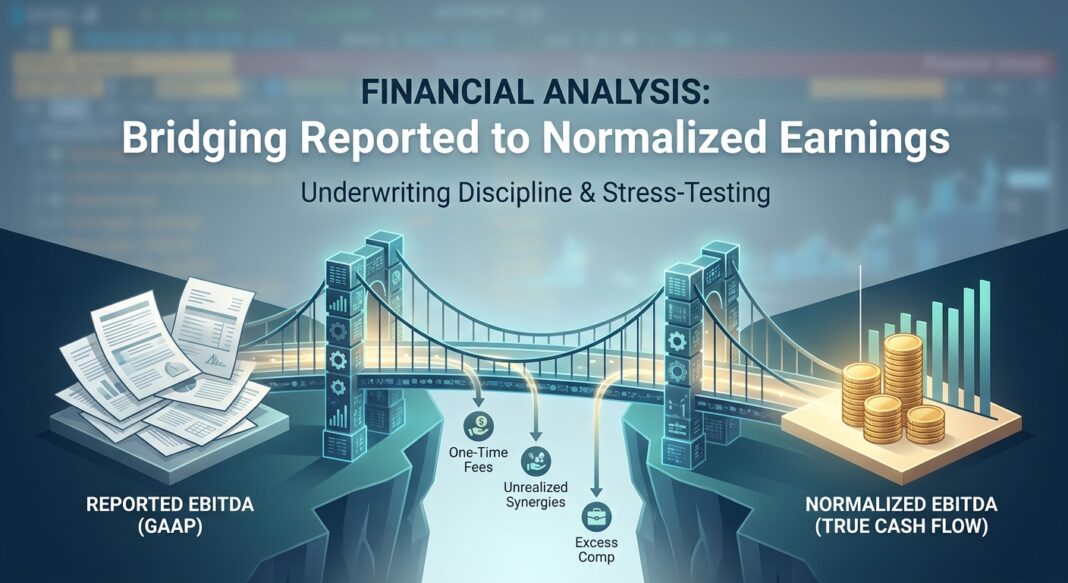
EBITDA Adjustments & Normalization: The Credit Underwriter’s Discipline for Stress-Testing Reported Earnings
The Underwriting Problem That Costs Lenders the Most
Every leveraged credit transaction begins with a deceptively simple question: How much does this company actually earn? The answer, almost universally, is not what the seller’s presentation says.
Across middle-market and sponsor-backed lending, the gap between reported GAAP earnings and “Adjusted EBITDA” has become one of the most consequential (and most abused) inputs in underwriting. A company that reports $8.5M of net income might present $12M of Adjusted EBITDA after a cascade of add-backs: one-time legal fees, restructuring costs, management bonuses above market, COVID revenue adjustments, and projected synergies that have never materialized. Each dollar of inflated EBITDA carries a multiple. At a 6.0x leverage multiple, a $500K unsupported add-back translates into $3M of incremental debt capacity the business cannot actually service.
For credit professionals at Bond Capital, the normalization exercise is not a courtesy review of a borrower’s schedule. It is a first-principles reconstruction of what the business actually earns, what it costs to operate at steady state, and how much cash flow will realistically be available to service debt under stress. Getting it wrong does not just compress returns; it drives defaults.
The Analytical Framework: Building a Clean EBITDA Bridge
Experienced credit underwriters treat every seller-provided EBITDA schedule as a starting point, not a conclusion. The goal is to independently reconstruct a Normalized EBITDA figure that reflects sustainable, recurring cash earnings available to service debt post-transaction. This is distinct from two related but materially different concepts:
- Adjusted EBITDA: Reported EBITDA after removing one-time and non-operating items, a cleaning exercise that tells you what the income statement would look like without noise.
- Normalized EBITDA: Goes further to reflect steady-state earnings under new ownership, incorporating market-rate management compensation, required reinvestment, and any structural cost additions that a buyer must fund. Normalized EBITDA can be lower than Adjusted EBITDA when the business requires additional costs post-close.
The EBITDA bridge moves in four steps:
- Anchor to GAAP: Start with audited or reviewed consolidated net income. Independently add back interest, taxes, D&A from verified financial statements.
- Category-by-category add-back review: Evaluate each adjustment against the four recognized categories (owner compensation normalization, genuinely non-recurring items, related-party economic normalization, and non-cash charges) with contemporaneous documentation for each.
- Apply haircuts and caps: Institutional lenders impose add-back caps. Many private credit agreements limit projection-based or non-recurring adjustments to a defined percentage of base EBITDA. A common market standard caps total add-backs at 25–35% of non-adjusted EBITDA for credits below $50M in earnings.
- Stress-test the bridge: Run the normalized figure through a base case, a downside case (revenue -10%, margin compression), and a severe stress case (revenue -20%) to determine the leverage ratio and interest coverage at each scenario.
Illustrative Example: $10M EBITDA Manufacturing Company
A lower-middle-market industrial manufacturer reports $7.2M of GAAP EBITDA. The seller presents $10.4M of Adjusted EBITDA, a 44% gap, a structural tell that warrants deep scrutiny.
| Line Item | Amount | Underwriter Verdict |
|---|---|---|
| Reported GAAP EBITDA | $7,200,000 | Anchored baseline |
| Owner Compensation Above Market (+$800K salary vs. $300K market) | +$500,000 | ✅ Accepted, documented, traceable |
| One-Time Legal Settlement (2024, non-recurring) | +$350,000 | ✅ Accepted, verified via invoices |
| Restructuring Costs (3rd consecutive year) | +$400,000 | ❌ Rejected, recurring in pattern |
| “COVID Revenue Lost” Add-Back (2026 claim) | +$600,000 | ❌ Rejected, stale, unsupportable |
| Pro-Forma Synergies (not yet realized) | +$750,000 | ❌ Rejected, future value, not historical earnings |
| Non-Cash Stock-Based Compensation | +$300,000 | ⚠️ Haircut, excluded from debt-sizing EBITDA |
| Related-Party Rent Normalization (below-market lease) | +$200,000 | ✅ Accepted, market comp verified |
| Underwriter-Accepted Normalized EBITDA | $8,250,000 | vs. Seller’s $10,400,000 |
The $2.15M gap between seller-presented and underwriter-accepted EBITDA is not trivial. At a 5.0x leverage multiple, it represents $10.75M of excess debt capacity the seller sought to claim, and that lenders must not extend.
Walking the Calculations: From Normalized EBITDA to Credit Decision
Once a defensible Normalized EBITDA is established, the underwriter constructs the full credit model. The three core metrics are:
1. Total Leverage Ratio (Debt / EBITDA)
Using the illustrative example: a $40M senior secured term loan against $8.25M of Normalized EBITDA yields a leverage ratio of 4.85x. Had the seller’s $10.4M EBITDA been accepted without scrutiny, the apparent leverage would have been just 3.85x, a full turn lower, and likely inside most lenders’ threshold for approval.
- Middle-market direct lending: Typical senior leverage cap is 4.5x–5.5x Normalized EBITDA
- Unitranche structures: May allow up to 6.0x–6.5x with strong equity cushion and tight maintenance covenants
2. Debt Service Coverage Ratio (DSCR)
DSCR measures cash flow available to cover all debt service obligations: principal amortization plus cash interest. Using the same example:
- Normalized EBITDA: $8.25M
- Less: Capex (maintenance): ($800K)
- Less: Cash taxes and working capital: ($650K)
- Free Cash Flow Available for Debt Service: $6.80M
- Annual Debt Service (cash interest + amortization): $5.20M
- DSCR: 1.31x
A DSCR of 1.31x provides modest headroom above most lender minimums of 1.10x–1.20x. It also means a roughly 24% EBITDA decline fully consumes the debt service buffer, a threshold that must be explicitly modeled in downside scenarios.
3. Fixed Charge Coverage Ratio (FCCR)
FCCR incorporates all fixed obligations (rent, leases, mandatory debt payments) and is a standard covenant metric in private credit agreements. Lenders typically require FCCR maintenance above 1.10x–1.25x on a trailing-twelve-month basis, tested quarterly.
Stress Scenario Summary
| Scenario | Revenue Change | EBITDA Margin | Normalized EBITDA | Leverage | DSCR |
|---|---|---|---|---|---|
| Base Case | Flat | 18.5% | $8.25M | 4.85x | 1.31x |
| Downside | -10% | 16.0% | $6.48M | 6.17x | 1.03x |
| Severe Stress | -20% | 13.5% | $4.86M | 8.23x | 0.77x |
The downside scenario pushes leverage above 6.0x and DSCR below 1.10x, two simultaneous covenant breaches that would require an amendment or waiver. In the severe stress case, debt service cannot be covered from operations. Stress testing reveals the true risk the base-case EBITDA obscures.
What Institutional Lenders Require, And What the Data Shows
The institutional credit community has hardened its standards around EBITDA normalization, particularly after the distressed exchange wave of 2024–2025. The following data points anchor the current risk environment:
📊 Credit Performance Data Box
- Private Credit Default Range (2025): Moody’s estimated the private credit default rate at approximately 1.6%–4.7% depending on whether distressed exchanges are included, reflecting a wide band of uncertainty unique to opaque private markets.
- Distressed Restructurings as % of All Defaults: Roughly 65% of all corporate defaults in 2025 were distressed restructurings (workouts, indenture modifications, and debt-for-equity swaps) rather than hard payment defaults, per Moody’s Ratings data.
- Leveraged Loan Conventional Default Rate (Aug 2025): The trailing 12-month default rate for conventional payment defaults in the U.S. leveraged loan market stood at 1.36%, with the combined rate (including distressed LMEs) at 4.37% per PitchBook LCD data.
- First-Lien Senior Secured Recovery: Moody’s long-term data shows first-lien senior secured loans have historically recovered approximately 60–80% of principal in default scenarios, with recent expected recoveries trending toward the lower end of that range (~68%) due to loan-heavy capital structures with reduced junior debt absorption beneath them.
- Add-Back Gap Benchmarks: Practitioners widely flag a reported-to-adjusted EBITDA gap of 5–10% as normal; 15–20% as generous; 25%+ as a structural warning requiring independent QoE validation before any credit approval.
Common Red Flags That Experienced Lenders Reject
- “One-Time” Costs That Recur Annually: If restructuring charges, system implementation costs, or legal fees appear in every trailing-twelve-month period, they are operating costs, not add-backs. A multi-year pattern of same-category “non-recurring” items is one of the clearest signs of earnings manipulation.
- Pro-Forma Synergies Without Realization Evidence: Adding future synergies to historical EBITDA inflates a historical measure with future value. Institutional lenders require synergies to be substantially realized (with documented cost saves and integration timelines) before crediting them in underwriting.
- Stock-Based Compensation Add-Backs for Leverage Sizing: SBC is non-cash but represents real economic cost transferred to employees. Accepting SBC-inflated EBITDA as the basis for debt sizing creates covenant headroom that does not reflect the actual cash-generating capacity of the business.
- Stale COVID or Macro-Event Adjustments: Claims of “lost COVID revenue” in 2025 or 2026 vintage underwriting have no analytical basis. Any macro-disruption adjustment must be limited to the period of quantifiable, verifiable impact and should not be carried forward as a permanent add-back.
- Uncapped Add-Back Baskets: Private credit agreements increasingly impose caps on total non-GAAP adjustments as a percentage of base EBITDA, precisely because expansive, uncapped add-backs can materially affect leverage outcomes and erode covenant protection.
The EBITDA Normalization Underwriting Checklist
Before any credit approval, the following diligence workflow should be completed independently of borrower or sponsor materials:
Documentation Requirements
- ☐ Audited or CPA-reviewed financials for trailing 3 fiscal years
- ☐ Management-prepared LTM financials tied to most recent period end
- ☐ General ledger detail or trial balance for each add-back category claimed
- ☐ Source invoices or payroll records for one-time legal, severance, and owner compensation adjustments
- ☐ Third-party Quality of Earnings (QoE) report (required for any transaction above $15M in EBITDA)
- ☐ Market compensation benchmarking for owner/executive pay normalization
Analytical Questions to Answer Before Approval
- ☐ What is the gap between reported GAAP EBITDA and Adjusted EBITDA as a percentage? Does it exceed 25%?
- ☐ Have any “non-recurring” add-backs appeared in more than one trailing period?
- ☐ Are any pro-forma synergies included? If so, what is the realization timeline and evidence base?
- ☐ Does SBC appear as an add-back? Has it been excluded from the leverage-sizing EBITDA?
- ☐ Has related-party rent, management fees, or intercompany pricing been adjusted to verified market rates?
- ☐ What is the Normalized EBITDA under the underwriter’s independent reconstruction? Does it differ materially from the seller’s schedule?
- ☐ Does the credit pass DSCR and FCCR thresholds in both base and downside scenarios?
- ☐ Has the leverage ratio been calculated on underwriter-accepted Normalized EBITDA, not seller-presented Adjusted EBITDA?
- ☐ Are covenant compliance thresholds set with sufficient cushion above stress-case EBITDA floors?
Key Takeaways for Credit Professionals
- 🔑 Treat every seller-presented EBITDA schedule as a starting point. Independent reconstruction from GAAP financials (line by line, with source documentation) is non-negotiable underwriting practice. Normalized EBITDA and Adjusted EBITDA are materially different concepts; conflating them is a frequent and costly error.
- 🔑 The reported-to-adjusted EBITDA gap is your first signal. A gap above 25% should trigger immediate QoE escalation and independent reconstruction before any term sheet is issued. Every rejected add-back at a 5x–6x leverage multiple reduces deal economics by a corresponding multiple of that adjustment.
- 🔑 Stress testing is not optional; it is where credit quality is actually revealed. A base-case DSCR of 1.31x may appear adequate; a downside DSCR of 1.03x reveals a credit that cannot withstand a single year of modest revenue pressure without breaching covenants. Size debt to the stress case, not the base case.
- 🔑 The 2025 distressed credit cycle was a direct consequence of aggressive EBITDA inflation in 2021–2022 vintage underwriting. With distressed restructurings accounting for roughly 65% of all corporate defaults in 2025 per Moody’s data, the primary lesson is structural: covenants anchored to inflated EBITDA provide no protection when performance reverts to GAAP reality.
- 🔑 Capital structure position determines recovery probability, but EBITDA quality determines whether you ever reach a default outcome. First-lien senior secured lenders historically recover 60–80% in default scenarios, but recovery analysis is a last resort. Rigorous normalization is the discipline that keeps credits performing and out of restructuring in the first place.


