
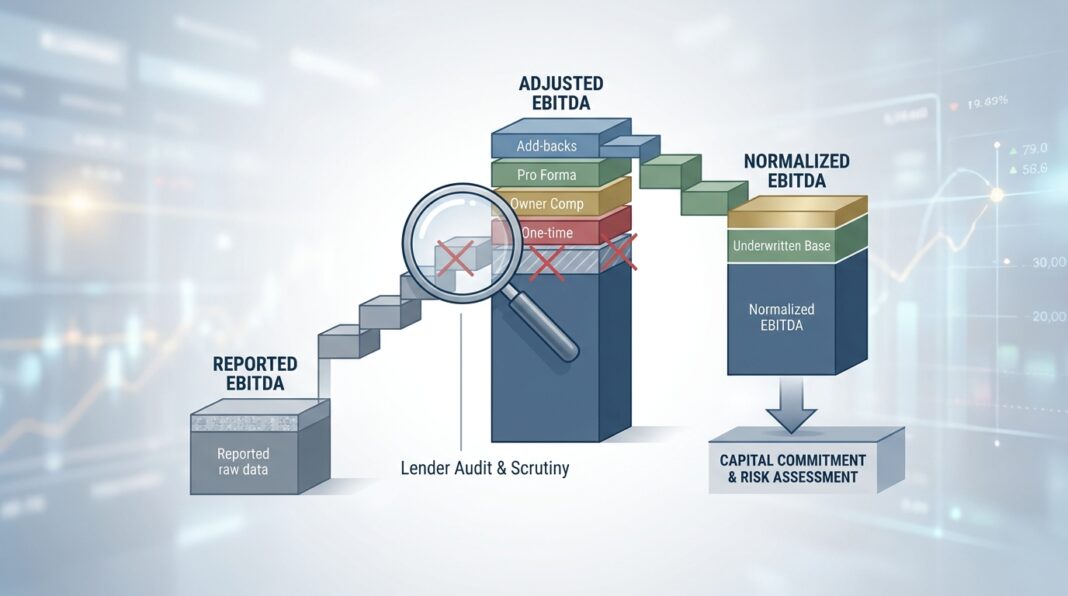
The Underwriting Challenge: Which EBITDA Are You Actually Lending Against?
Every credit memo begins with the same foundational question: how much cash flow does this business actually generate? But in modern leveraged finance and direct lending, that question is rarely answered by the income statement alone. Sellers, sponsors, and management teams routinely present an Adjusted EBITDA figure: a number that can diverge meaningfully from reported earnings after a cascade of add-backs, normalizations, and pro forma adjustments.
For the credit underwriter, this divergence is not a technicality. It is the single most consequential variable in the entire underwriting process. Leverage multiples, debt service coverage ratios (DSCR), and maximum loan proceeds all flow directly from EBITDA. An inflated base creates inflated debt capacity, and compressed margin for error when business conditions deteriorate.
As the current deal environment reflects, lender scrutiny has sharpened considerably. The bridge between reported and adjusted EBITDA is no longer a rounding exercise; it is a primary risk discipline. This article walks through a rigorous methodology for auditing EBITDA normalizations, identifying red flags, and stress-testing adjusted earnings before any capital commitment is made.
The Analytical Framework: Adjusted vs. Normalized EBITDA
Before building the analysis, underwriters must establish definitional precision. Two related but distinct concepts are in play:
- Adjusted EBITDA: The bridge from reported financials to a cleaned-up earnings figure after removing one-time and non-operating items.
- Normalized EBITDA: A further refinement that reflects the earnings a buyer or lender can sustainably underwrite: incorporating steady-state staffing costs, market-rate compensation, and required reinvestment. Normalized EBITDA can be lower than Adjusted EBITDA when the business requires additional costs under new ownership.
This distinction is commercially significant. At an 8.0x EBITDA multiple, a $320,000 difference between seller-claimed and lender-underwritten EBITDA represents $2.56 million of enterprise value, and a proportional shift in debt capacity and attachment point risk.
The most common categories of EBITDA add-backs in a leveraged transaction include:
- Excess owner or executive compensation above market replacement cost
- Owner perks and discretionary personal expenses run through the business
- One-time legal settlements and non-recurring severance
- Transaction-related fees and advisory costs
- Related-party rent or management fee normalization to market rate
- Non-cash charges (stock-based compensation, D&A adjustments)
- Pro forma cost savings or revenue synergies
Illustrative Example, $10M Reported EBITDA Manufacturing Company:
| Line Item | Seller Claim | Lender View | Variance |
|---|---|---|---|
| Reported EBITDA | $8,500,000 | $8,500,000 | – |
| + Excess Owner Compensation | $900,000 | $550,000 | $(350,000) |
| + One-Time Legal Settlement | $400,000 | $400,000 | – |
| + Pro Forma Cost Savings | $600,000 | $0 | $(600,000) |
| + Related-Party Rent Adjustment | $200,000 | $150,000 | $(50,000) |
| Adjusted / Normalized EBITDA | $10,600,000 | $9,600,000 | $(1,000,000) |
At a 4.5x leverage covenant and 5.0x total debt, the seller-underwritten basis supports $53M of debt. The lender-underwritten basis supports $48M, a $5M reduction in proceeds that can break deal pricing or force equity reallocation.
Walking Through the Analysis: Calculation and Red Flag Identification
The credit underwriter’s job is to independently reconstruct EBITDA from source documentation, not simply accept the seller’s schedule. This means:
Step 1: Build the LTM (Last Twelve Months) Bridge
Obtain at least three years of audited financials plus interim management accounts. Reconstruct LTM revenue and EBITDA from audited periods plus the stub period. This prevents sellers from cherry-picking trailing periods during an earnings upswing.
Step 2: Stress-Test Each Add-Back Category
Apply the following tests to each claimed adjustment:
- Is it truly non-recurring? Legal costs, restructuring charges, and severance that reappear annually are, by definition, recurring. Relabeling ongoing costs as one-time is one of the most common EBITDA inflation techniques.
- Is it documented? Excess owner compensation adjustments are only credible after deducting the market cost of replacing the owner's operating role. Pro forma cost savings are rejected unless already fully implemented in the run rate with documented evidence.
- Does it survive a cash flow test? A QoE ratio below 1.0x (operating cash flow divided by net income) is a structural warning signal that reported earnings are not fully supported by actual cash generation.
Step 3: Run Downside Scenarios
Using the lender-underwritten normalized EBITDA as the base, model three scenarios:
- Base Case: Flat EBITDA, rates unchanged, test debt service coverage and leverage covenant headroom
- Stress Case: EBITDA declines 15-20%, test whether the company can still service debt and remain covenant-compliant
- Severe Case: EBITDA declines 25-30%, estimate time-to-covenant-breach and recovery value given collateral structure
Real-world covenant structures confirm why this matters. A lender that extends credit against a 5.0x net leverage covenant while the borrower is already at 4.8x has less than 4% EBITDA cushion before a technical breach triggers lender rights.
Industry Standards, Credit Data, and What Institutional Lenders Require
What Institutional Lenders Look For
Direct lenders and institutional credit desks have tightened EBITDA diligence standards significantly in the post-2022 rate environment. The expectation today is that seller-provided adjustment schedules are viewed as a starting point, not a conclusion. Independent Quality of Earnings (QoE) reports commissioned by the buy-side are the market standard for transactions above $1–2M in deal value, and are increasingly mandatory for sponsored transactions regardless of size.
Lenders independently evaluate each adjustment to determine whether it is reasonable, documented, and consistent with how the business will operate after closing. Anticipated cost savings that depend on post-closing management actions are routinely rejected. Excess owner compensation add-backs are only accepted net of a market-rate replacement salary, which must be explicitly quantified.
📊 Credit Performance Data Box
- S&P Global (Dec. 2024): Global speculative-grade corporate default rate was 4.0% as of September 2024, projected to decline to 3.5% by September 2025. Roughly 58% of defaults in the current cycle have been distressed exchanges rather than hard bankruptcies, a structural shift with implications for recovery modeling. (Source: S&P Global Ratings, Dec. 2024)
- Moody's (Jan. 2025): The average probability of default for U.S. companies reached a post-Global Financial Crisis high of 9.2% at end-2024 and is expected to remain elevated through 2025. High-yield bond issuers are projected to see a realized default rate of 3.2% for 2025, rising above 4% by Q1 2026. (Source: Moody's Asset Management Research, July 2025)
- KBRA (2025): Lower middle market default rates are forecast to reach 3% by year-end, a reversal of prior-year trends, driven by a growing pipeline of stressed borrowers. (Source: Valuation Research Corp., citing KBRA forecast)
- Cliffwater CDLI (2025 Full Year): The Cliffwater Direct Lending Index returned 9.3% for calendar year 2025, with interest income of 10.4% serving as the primary return driver. Non-accruals and realized losses held steady or improved, remaining well below historical averages. The index covers approximately 21,000 directly originated U.S. middle market loan holdings totaling $549 billion in assets. (Source: Cliffwater LLC, March 2026)
- Middle Market Leverage Risk (2024–2025): Median leverage in the middle market credit population hit 7x in 2024, with 20% of companies reporting below 1x EBITDA interest coverage, a structural vulnerability for floating-rate direct lending portfolios. (Source: ABF Journal / Secured Research, 2025)
Common Red Flags in EBITDA Normalization
- Add-back schedules with no supporting documentation: every adjustment must be traceable to source records
- Pro forma cost savings that are forward-looking: savings not yet in the run rate are speculation, not EBITDA
- Owner compensation add-backs without market replacement cost offset: a classic inflation tactic in founder-led businesses
- Legal cost add-backs without resolution confirmation: recurring litigation risk is an operational cost, not a one-time event
- Revenue reclassification or timing pulls: shifting deferred revenue recognition to inflate the LTM window
- Large gap between adjusted EBITDA and operating cash flow: a QoE ratio below 1.0x signals earnings quality deterioration
- Covenant headroom below 10%: leverage ratios above 4.5x near maximum covenant thresholds leave virtually no cushion for any operational softness
Underwriting Diligence Checklist: EBITDA Normalization
Use the following checklist to validate adjusted EBITDA in any direct lending, acquisition finance, or sponsor-backed credit transaction:
✅ Documentation Requirements
- Three years of audited financial statements (or reviewed financials at minimum)
- LTM stub period with management accounts and reconciliation to audited figures
- Independent Quality of Earnings report from a third-party accounting firm
- Detailed add-back schedule with line-item documentation for each adjustment
- Employment agreements and market compensation benchmarks for owner add-back review
- Lease agreements confirming related-party rent normalization basis
✅ Questions to Ask Management
- Which add-backs repeat across multiple fiscal years? (recurring ≠ non-recurring)
- Have any projected cost savings already hit the P&L? If not, what is the implementation timeline and risk?
- What is the market salary for the role the owner currently performs?
- Are any customers, contracts, or revenue streams non-transferable under a change of control?
- What maintenance capex is required to sustain current EBITDA levels?
✅ Quantitative Tests
- Calculate QoE ratio: Operating Cash Flow ÷ Net Income (flag if consistently below 1.0x)
- Bridge seller Adjusted EBITDA to lender Normalized EBITDA, document every variance
- Compute pro forma leverage on lender-underwritten EBITDA (not seller EBITDA)
- Model DSCR under base, stress, and severe EBITDA scenarios
- Measure covenant headroom: distance from current leverage to maximum permitted ratio
Key Takeaways
- EBITDA is not a standard metric. Adjusted EBITDA and Normalized EBITDA are negotiated constructs, lenders must rebuild them independently from source documentation, not accept seller schedules at face value.
- Every rejected add-back cascades through deal economics. At a 6x multiple, a single $100,000 disallowed add-back reduces enterprise value by $600,000 and shifts debt capacity proportionally, directly affecting returns and loan sizing.
- Pro forma savings require evidence, not projections. Add-backs for anticipated cost reductions that have not yet appeared in the run rate are among the most aggressive (and most commonly challenged) normalizations in institutional credit underwriting.
- Covenant headroom is a direct proxy for credit risk. Borrowers operating near maximum leverage covenants (less than 10% headroom) have minimal operational buffer. In a stress scenario with 15–20% EBITDA compression, technical default and lender remediation can accelerate rapidly.
- Credit loss data validates the discipline. With middle market median leverage near 7x and 20% of companies below 1x interest coverage, normalized EBITDA is not an academic exercise; it is the underwriter's first and most powerful line of credit defense.


