
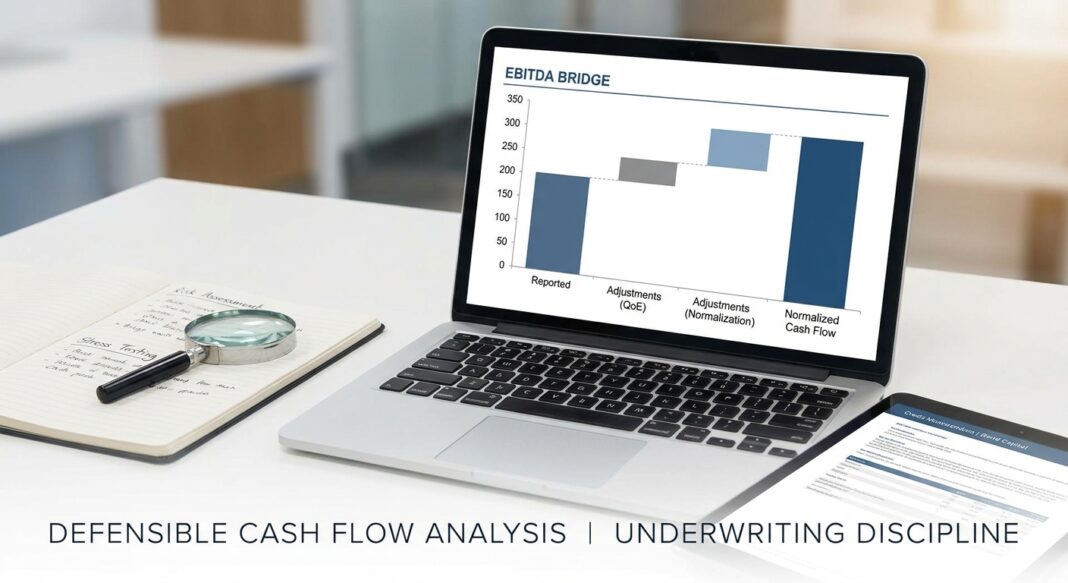
EBITDA Adjustments and Normalization: The Credit Underwriter’s Discipline for Defensible Cash Flow Analysis
The Underwriting Challenge
Here is the question every credit committee should ask before approving a leveraged loan: Is the EBITDA we are underwriting real? Not just arithmetically correct, but economically defensible, reproducible under new ownership, and stress-tested against a realistic downside.
The gap between reported EBITDA and lender-accepted EBITDA can be enormous. According to S&P Global research, add-backs in the average sale process now account for 29% of adjusted EBITDA, and only 8% of companies report post-closing EBITDA that actually exceeds the management projections presented before signing. [1] That is not a rounding error. That is structural overstatement built into deal economics at origination.
In today’s credit environment, this problem has sharper consequences. The private credit default rate in 2025 ranged from approximately 1.6% to 4.7%, depending on whether distressed exchanges are included. [2] Critically, roughly 65% of all corporate defaults in 2025 were distressed restructurings: soft credit events that defer, rather than resolve, underlying stress. [3] Many of those workouts trace directly back to overleveraged entry points built on inflated EBITDA at origination. The discipline of normalization is not procedural housekeeping. It is the first and most critical line of credit defense.
The Analytical Framework: Building the EBITDA Bridge
EBITDA normalization is not about inflating numbers to make a deal work. It is about clarity, credibility, and answering one precise underwriting question: What will this business sustainably earn under new ownership, at arm’s-length economics, with no one-time distortions in the base case? [4]
Practitioners distinguish between two related but non-identical concepts:
- Adjusted EBITDA: The bridge from reported financials to a cleaned-up earnings number after removing one-time and non-operating items.
- Normalized EBITDA: Goes further: reflecting the earnings a buyer can sustainably underwrite after considering steady-state staffing, market compensation, and necessary reinvestment. Normalized EBITDA can actually be lower than adjusted EBITDA when the business requires costs under new ownership that the seller was not incurring. [5]
The normalization bridge has three structural layers, each tested independently in diligence with the burden of proof on the seller for every line: [6]
- Definitional Adjustments: The standard EBITDA add-backs: interest, taxes, depreciation, amortization. These are not contentious but must be verified against source documents.
- Quality-of-Earnings (QoE) Adjustments: Remove truly non-recurring items: a settled lawsuit, a one-time building sale, severance from a restructuring that will not repeat.
- Normalization Adjustments: Correct items that are recurring but priced at non-market economics: owner compensation above market replacement cost, related-party rent above market, family members on payroll without substantive roles, and discretionary personal expenses run through the business. [5]
The lender’s posture is clear: seller-provided schedules are a starting point, never a conclusion. [4] Every adjustment is multiplied by the agreed valuation multiple. A single rejected $100K add-back at a 6.0x multiple costs $600K in enterprise value and reduces supportable debt by an equivalent amount. [5]
📄 Working Example: $10M EBITDA Manufacturing Company
A mid-market manufacturer presents $10.0M in adjusted EBITDA. The underwriter’s independent QoE review surfaces the following:
| Line Item | Seller Claim | Lender Accepted | Variance |
|---|---|---|---|
| Reported EBITDA | $7.5M | $7.5M | – |
| Owner Comp Normalization | +$1.2M | +$0.7M | -$0.5M |
| One-Time Legal Settlement | +$0.6M | +$0.6M | – |
| Related-Party Rent (below market) | +$0.4M | +$0.2M | -$0.2M |
| “Missed Budget” Revenue Add-Back | +$0.3M | $0 | -$0.3M |
| Recurring IT Investment (relabeled one-time) | $0 | -$0.4M | -$0.4M |
| Lender-Accepted Normalized EBITDA | $10.0M | $8.6M | -$1.4M (-14%) |
At a 5.5x leverage multiple, this $1.4M EBITDA variance translates to a $7.7M reduction in supportable debt, a material change to deal structure and credit risk.
The Analysis: Key Metrics and Stress Testing
Once normalized EBITDA is established, the underwriter applies it to the credit’s core financial ratios. Each ratio is calculated on lender-accepted EBITDA, not the seller’s promoted figure.
Core Leverage and Coverage Metrics
- Total Debt / EBITDA (Leverage Multiple): The primary sizing constraint. Lenders underwrite acquisition financing based on Debt/EBITDA ratios as the governing structural test. [1] An inflated EBITDA numerically supports more debt than the business can actually service, a structural fault that only surfaces when cash flows disappoint.
- Debt Service Coverage Ratio (DSCR): Net Operating Income (or Free Cash Flow) ÷ Total Debt Service. Research from commercial lending institutions shows that loans with DSCR below 1.0x default at rates exceeding 40%, while those above 1.5x default at less than 5%. [7] The lender’s minimum DSCR floor is therefore a hard credit gate, not a guideline.
- Fixed Charge Coverage Ratio (FCCR): (EBITDA − CapEx − Taxes) ÷ (Interest + Principal). A more conservative view of cash available for debt service that explicitly accounts for maintenance capital expenditure, often a significant normalization item in asset-intensive businesses.
Stress Testing the Base Case
The underwriter must run at least three scenarios against lender-accepted normalized EBITDA:
- Base Case: Underwritten EBITDA with no growth. Confirm leverage and DSCR are within policy at entry.
- Downside (−15% EBITDA): Typical recessionary revenue compression. Does the company breach its leverage covenant? Does DSCR fall below 1.10x?
- Severe Stress (−30% EBITDA): Stress-test the recovery thesis. At what EBITDA level does the loan become impaired? Is there meaningful asset coverage to support recovery?
This stress discipline matters because, as Moody’s research confirms, the cohort of borrowers that underwent distressed exchanges in 2024 and 2025 deserves careful monitoring, with the outcome of those workouts expected to be determined in the next 12 to 24 months in a macro environment that remains uncertain. [3] Lenders who stress-tested their entry EBITDA will have considerably more negotiating runway than those who did not.
Industry Standards: What Institutional Lenders Demand
The institutional standard is unambiguous: normalized earnings must be traceable to source records, reasonable in economic rationale, and consistent with how the business will operate post-close. [8] The accepted add-back standard is not perfection; it is traceability and reasonableness. Can the adjustment be traced to records? Would the cost truly disappear under new ownership? Is the adjustment consistent with steady-state operations?
On any deal above approximately $1M of EBITDA, the buyer’s lender will commission a Quality of Earnings report from an independent accounting firm. [9] Unsupported add-backs are routinely removed, and the consequences are structural: an inflated normalized EBITDA that lenders reject in their own underwriting does not support the debt capacity needed to close a transaction at the agreed purchase price. [1]
Common Red Flags Underwriters Must Reject
- “Missed budget” revenue add-backs: Projecting hypothetical revenue that was never earned is speculative, not historical. It is a hope, not a fact. [10]
- Recurring expenses relabeled as one-time: If an expense appeared in 2023, 2024, and 2025 in the same category, calling it one-time in 2026 will not survive diligence review. [6]
- Customer concentration adjustments: A churned customer is a business reality, not a normalization event. Removing that revenue gap requires a documented, contracted replacement, not a narrative. [10]
- Undisclosed related-party transactions: Below-market rent, family payroll, and management fee waivers that will not continue must be fully re-priced at arm’s length. Partial adjustments create hidden cost gaps post-close. [11]
- Synergistic or forward-looking add-backs: The line between accepted and rejected is whether the add-back describes historical, documented, non-recurring cash versus forward-looking, speculative, or synergistic cash. Buyers price the former into the multiple; the latter belongs in the equity return model. [9]
📊 Credit Performance Data Box
- Private credit default rate (2025): Estimated at 1.6%–4.7%, depending on inclusion of distressed exchanges. Moody’s, April 2026
- Distressed exchanges as share of all defaults: ~65% of all corporate defaults in 2025 were distressed restructurings, not hard payment defaults. Moody’s, May 2026
- Covenant recovery gap: Moody’s found lenders recovered an average of 57% on first-lien covenant-lite loans (2023–mid 2025), compared to 66% on loans with financial maintenance covenants, a 9-point spread in favor of covenanted structures. Principal Asset Management / Moody’s, 2025
- Cov-lite market penetration: 91% of outstanding U.S. leveraged loans were covenant-lite at year-end 2024, and 93% of all new institutional issuance carried no maintenance covenants. Resonanz Capital / Angel Investors Network, 2025
- EBITDA add-back inflation: Add-backs account for 29% of adjusted EBITDA in the average sale process; only 8% of companies report post-closing EBITDA exceeding management projections. S&P Global, via Ferdinand Partners, 2026
- DSCR default sensitivity: Loans with DSCR below 1.0x default at rates exceeding 40%; loans with DSCR above 1.5x default at less than 5%. Commercial Lending Research, 2026
EBITDA Normalization Underwriting Checklist
Use this checklist at the term sheet stage and again following receipt of the Quality of Earnings report. Every item should be documented in the credit memorandum.
✅ Documentation & Source Verification
- Obtain 3 years of audited or reviewed financial statements and trailing 12 months (TTM) management accounts
- Reconcile the CIM’s EBITDA bridge to tax returns, general ledger, and bank statements, line by line
- Confirm that reported net income in the CIM matches the company’s tax filings for the same periods
- Require third-party Quality of Earnings (QoE) report from an independent accounting firm on deals above $1M EBITDA [9]
✅ Adjustment-by-Adjustment Testing
- Apply the “prior-year test”: if the expense appeared in each of the last three years in the same category, it is not one-time [6]
- Re-price all owner compensation to market replacement cost, neither inflated nor understated [4]
- Identify and re-price all related-party transactions (rent, management fees, intercompany services) to arm’s length [11]
- Reject all forward-looking, synergistic, or “missed budget” add-backs with no documentary support [10]
- Identify recurring capital expenditure that sellers have omitted or underrepresented; adjust normalized EBITDA downward for required maintenance CapEx
✅ Ratio Calculation & Stress Testing
- Calculate Debt/EBITDA, DSCR, and FCCR using only lender-accepted normalized EBITDA
- Run three scenarios: base, −15%, and −30% EBITDA; confirm covenant compliance and DSCR floor at each level
- Calculate the break-even EBITDA level at which interest coverage falls below 1.0x and leverage covenants breach
- Assess collateral coverage and recovery at stressed enterprise value (4.0x–5.0x distressed EBITDA multiple for middle-market credits)
✅ Questions to Ask Management
- What is the contractual basis for each revenue add-back? Show us the contracts.
- Which of the claimed cost savings have already been implemented, and which are projected?
- What is the maintenance CapEx required to hold current revenue, not growth CapEx?
- Has the company ever had a year where actual EBITDA exceeded management’s prior-year projection? If not, why should underwriters accept management’s projections now?
Key Takeaways
- 🔐 Normalized EBITDA is not the seller’s number. It is the lender’s independently derived, evidence-tested view of sustainable cash flow. Sellers’ schedules are a starting point, not a conclusion.
- 📊 Adjustment inflation is measurable and material. With add-backs accounting for ~29% of the average adjusted EBITDA and fewer than 1-in-10 companies meeting post-close projections, the structural risk of EBITDA-based overleveraging is well-documented and systematic.
- ⚡ Every dollar of rejected add-back reduces debt capacity by a multiple of that dollar. At a 6.0x leverage multiple, a $500K add-back rejection reduces supportable debt by $3.0M, reshaping the deal’s entire capital structure and viability.
- 🛡️ Covenanted structures provide measurably superior recovery protection. Moody’s data shows a 9-point recovery rate advantage for first-lien loans with maintenance covenants over cov-lite equivalents in the 2023–2025 period, evidence that covenant design is an underwriting decision, not a legal formality.
- 🔍 Stress testing must be built into origination, not crisis response. With 65% of 2025 corporate defaults being distressed exchanges rather than hard failures, the credits that fared worst were those where lenders lacked early-warning mechanisms and had underwritten to aggressive, un-stressed EBITDA at entry.


