
The Financing Challenge: You Have a Deal. You Don’t Have Enough Balance Sheet.
You run a profitable lower-middle-market business: call it $6M EBITDA, $48M enterprise value, a platform that has outgrown organic reinvestment. An add-on acquisition sits on the table: $20M purchase price, a target that would add $3M of EBITDA on day one. Your bank will stretch the revolver, but not far enough. Your equity is tied up in the platform. The gap between what senior debt can fund and what the deal requires is the defining structuring problem for every growth-stage operator in 2026.
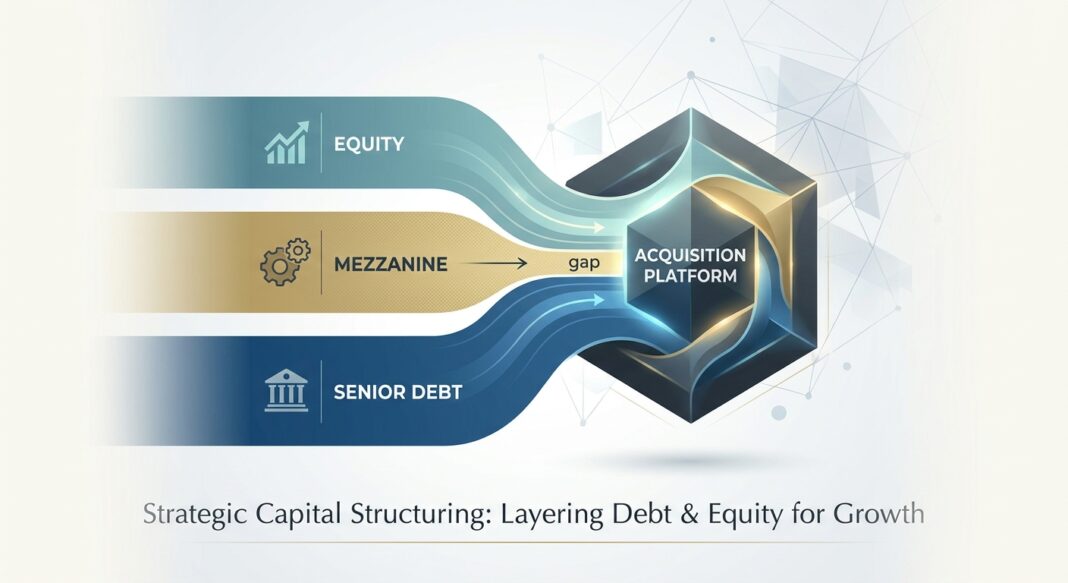
That gap has a name, gap capital, and filling it intelligently is what separates operators who close at acceptable dilution from those who either give up control unnecessarily or lose the deal entirely. The capital stack for a growth-stage acquisition is not a single product decision. It is a sequenced negotiation across at least three distinct layers, each with its own cost, covenant logic, and claim on the business’s cash flow. This article maps those layers, prices them against current market data, and walks through the tactical process of running a structured raise from initial quantification to final term sheet.
The Cost-of-Capital Spectrum: From Bank Debt to Equity
Every layer of the acquisition capital stack has a different cost precisely because each layer carries a different risk profile and sits in a different position in the repayment waterfall. Understanding where each instrument prices (and why) is the first step toward building a rational structure.
Layer 1: Senior Secured Debt (Cheapest, Most Constrained)
Senior secured debt is the foundation of any acquisition stack. It is the cheapest capital available because senior lenders are first to be repaid and hold a first-priority lien on all assets. equitymultiple.com describes it as “the safest position in the capital structure”, lower risk, lower return. In practice, that safety translates to lower pricing for the borrower.
In Q2 2026, senior secured lending for lower-middle-market businesses priced at SOFR plus 400–550 basis points, putting all-in coupons in the 9%–10% range, per S&P Global LCD data. Unitranche facilities (which collapse senior and subordinated debt into a single instrument with one lender, one credit agreement, and one covenant package) ran slightly wider at SOFR plus 500–675 basis points. Unitranche total leverage typically reaches 4.0x–4.5x EBITDA, with a six-year tenor, 1% annual amortization, and a maintenance leverage covenant as the primary protection.
The constraint is leverage capacity. Most senior lenders cap exposure at 3.0x–3.5x EBITDA on a standalone basis; unitranche providers stretch that to 4.0x–4.5x. For a $6M EBITDA platform, senior capacity tops out at roughly $18M–$27M. If the acquisition purchase price plus transaction costs exceeds that amount (and in an 8.0x multiple environment, it frequently does) a second layer is required.
Layer 2: Mezzanine or Subordinated Debt (The Gap Filler)
Mezzanine debt sits below senior debt in the payment waterfall and compensates lenders for that subordination through a higher all-in cost. In 2026, mezzanine pricing has cleared 11%–14% cash coupon, often with a 1%–3% PIK (payment-in-kind) toggle and a small equity kicker in the form of warrants or an equity co-investment right. Tenor runs 7–8 years, subordinated behind the senior facility through an intercreditor agreement.
Mezzanine adds roughly 1.0x–1.5x additional leverage on top of the senior layer, bringing total debt to 4.5x–5.5x EBITDA for qualified borrowers. The all-in IRR for mezzanine providers, once warrants are included, reaches 17%–25%, which is why the structure typically requires a defined equity kicker mechanism negotiated at close.
Unitranche has absorbed a significant portion of what was historically a standalone mezzanine market. However, mezzanine remains the preferred instrument when a borrower has an existing senior relationship with a bank they do not want to displace, when deal size warrants a split-tranche structure, or when the borrower’s EBITDA quality or sector profile makes a unitranche provider uncomfortable taking the full 5x exposure alone.
Layer 3: Preferred Equity or Minority Common (Most Flexible, Most Expensive)
Preferred equity and minority common equity sit at the bottom of the debt stack and top of the equity waterfall. Preferred structures offer a defined return (typically a 12%–15% dividend, cash or PIK) with a liquidation preference and limited governance rights. Minority common from a family office or growth equity fund targets a 22%–28% IRR, a meaningfully higher cost of capital than debt, but one that carries no fixed repayment obligation and no covenant default risk.
For operators who have exhausted senior and mezzanine capacity but still need incremental equity to close the stack, preferred equity is the least-dilutive option. Structured minority preferred (offered by firms such as Main Street Capital and others) can preserve 82%–88% of common ownership while still capitalizing the gap.
The Stack in Practice: A $48M Platform Acquiring a $20M Add-On
Consider a concrete example. A $6M EBITDA services platform has $18M of existing senior debt (3.0x). It is acquiring an add-on for $20M. Pro forma EBITDA of the combined entity is $9M. The operator needs to fund $20M of purchase price plus $1.5M of transaction costs, a total need of $21.5M, while keeping pro forma leverage within acceptable limits and preserving majority control.
| Layer | Amount | Leverage Multiple (Pro Forma) | Pricing (2026 Market) | Key Terms |
|---|---|---|---|---|
| Unitranche (Refinance + Acquisition) | $36M | 4.0x EBITDA | SOFR + 525 bps (~9.5%) | 6-yr tenor, 1% amort, leverage covenant 5.0x step-down |
| Mezzanine | $9M | 1.0x EBITDA | 12.5% cash + 1.5% PIK + 2% warrant coverage | 7-yr bullet, subordinated, incurrence covenants only |
| Operator Equity / Rollover | $7.5M | – | – | Rolled from existing balance sheet equity; 75%+ ownership retained |
| Total Sources | $52.5M | 5.0x Total | – | – |
The blended all-in cost of the debt stack in this example sits at approximately 10.2%–10.8% before equity dilution, substantially below the 22%–28% cost of bringing in a growth equity partner for the full gap. The operator retains majority ownership and operating control. The mezzanine provider’s warrant coverage of 2% on $9M translates to $180K of equity exposure, meaningful to the lender as upside participation, modest from the operator’s perspective as a dilution event.
Critically, the refinancing of the existing $18M senior facility into a new unitranche is not incidental; it is strategic. A single intercreditor relationship between the unitranche provider and the mezzanine fund is far simpler to manage than a three-party structure involving the legacy bank, a new term lender, and a mezz fund. Speed, simplicity, and documentation efficiency justify the marginal cost difference.
Current Market Terms: What the Data Shows in Mid-2026
The lower-middle-market private credit environment in mid-2026 is characterized by widening spreads, improved lender protections, and a more selective underwriting posture after a period of intense competition compressed terms to borrower-favorable levels. Key data points:
- Unitranche pricing: The dominant LMM structure in 2026 is a first-lien unitranche of 3.5x–4.5x EBITDA, six-year tenor, 1% annual amortization, one leverage covenant, and a fixed charge coverage covenant, priced at SOFR plus 525 bps on average, per Lincoln International Q2 2026 data.
- Spread widening: Direct lending spreads widened by roughly 50–100 basis points since late 2025, alongside a return to stronger lender protections, after a stretch where heavy fundraising had left too much capital chasing too few deals, according to Lord Abbett’s 2026 Midyear Investment Outlook.
- Mezzanine cost: Mezzanine cash interest portions have typically run 11%–14% in the current rate environment, with all-in IRR including warrants reaching 17%–25%.
- Total leverage: LMM buyout total leverage sat at a 4.2x TEV median through Q1 2026, per GF Data, with senior debt averaging 3.1x and sub debt filling the gap to 4.5x, meaningfully lower than the 6x–7x peak of 2021.
- Equity contribution: Equity contribution across the LMM in H1 2026 averaged 51.7%, up from 40% in 2019, driven by SOFR at 4.33% and tighter senior lender covenants, making gap-capital efficiency more critical than at any point in the past decade.
- LMM spread premium: In the lower-middle-market segment, the average spread per unit of leverage reached 145 bps in Q2 2026, compared to 112 bps in the upper middle market, confirming that smaller borrowers pay a meaningful liquidity and complexity premium.
The implication for operators: the rate environment has structurally reset the cost of the debt stack upward relative to 2021 peaks, and the equity required to close a deal has grown proportionally. Efficient gap-capital structuring is no longer optimization; it is necessity.
The Gap Capital Playbook: Quantify, Prepare, Run, Negotiate
Step 1: Quantify the Gap
Start with a lender-grade financial model. The gap is not simply “purchase price minus bank commitment.” It is total sources required (including transaction costs, funded escrows, working capital adjustments, and integration reserves) minus the senior debt capacity at a prudent leverage multiple. Build base-case and downside scenarios. The downside case drives covenant headroom conversations. Lenders that see a disciplined downside plan, with clearly articulated management levers at a 15%–20% EBITDA decline, are more likely to offer pricing flexibility and covenant room.
Separately, clean the collateral data. If ABL is in the stack, AR aging reports, inventory listings, and borrowing base certificates must reconcile to the ledger. Eligible receivables typically advance at 85%–90%; inventory at 40%–60%. These advance rates determine how much working capital capacity the business brings to the table independent of cash flow underwriting.
Step 2: Prepare the Data Room
Private credit lenders underwrite the credit themselves. They examine customer concentration, contract quality, and management depth with an intensity once reserved for the buyer’s own team. A data room that does not preemptively address these questions will generate weeks of back-and-forth that costs time and signals disorganization. Minimum documentation: three years of audited financials, 24 months of monthly management accounts, a 12–36 month integrated model with covenant sensitivities, a use-of-proceeds memo tied to specific cash generation milestones, and a legal package that addresses existing liens, IP ownership, and any pending litigation.
Step 3: Run a Targeted Process
Select counterparties by ticket size and sector focus. The LMM unitranche market is dominated by a defined group of direct lenders (including firms like Ares Capital, Blue Owl Capital, Antares Capital, Twin Brook Capital Partners, Golub Capital, and Monroe Capital) that actively write $25M–$200M EV deals. Mezzanine capacity for sub-$50M EBITDA companies is provided by a smaller universe of dedicated funds and SBIC vehicles. Running a process with lenders who are structurally incapable of writing your ticket wastes time and creates noise in a market where information travels quickly.
Stage the process: issue an executive summary to test interest, follow with a CIM and model to qualified parties, run management presentations in parallel with credit committee submissions, and set a clear indicative term sheet deadline. Respond fast and consistently: one source of truth, one data room owner, deadline discipline. Approvals follow clarity.
Step 4: Negotiate the Structure
The pricing headline, the spread, is rarely the most important variable. Private credit pricing is an entire economic package: upfront fees, exit fees, original issue discounts, and prepayment provisions layered on top of the headline spread. Two facilities carrying nearly identical rates can produce meaningfully different economics over the life of a deal.
For mezzanine specifically, the negotiation points that matter most are: (1) warrant coverage percentage: push for 2%–3% of drawn amount rather than 4%–6%; (2) PIK optionality: negotiate the right to toggle PIK on and off rather than a fixed PIK obligation, preserving cash flow flexibility in a stress scenario; (3) call protection: a no-call period of 12–18 months is standard, but resist non-call provisions beyond 24 months that would limit refinancing flexibility; and (4) covenant headroom: negotiate a leverage covenant at 0.5x–0.75x above projected peak leverage, not current leverage, so that the business can absorb seasonal or integration-related EBITDA variance without a technical default. Fixed charge coverage of 1.25x provides real cushion; 1.10x is operationally tight.
Finally, require committed papers with capped market flex language on any deal above $30M. Uncommitted term sheets with unlimited flex give the lender the ability to reprice the structure at close, creating closing risk that is particularly damaging in time-sensitive acquisition processes.
Key Takeaways
- Senior debt is the cheapest layer, but it has a ceiling. In 2026, senior LMM debt prices at SOFR+400–550 bps and maxes out at 3.0x–4.5x EBITDA depending on structure. Know your senior capacity before approaching gap providers.
- Mezzanine fills the gap at 11%–14% cash coupon, considerably cheaper than equity. The all-in blended stack cost is almost always lower when mezzanine displaces equity, even after warrant dilution, as long as cash flow can service the debt in the base case.
- Unitranche simplifies execution. A single lender, single credit agreement, and single covenant package reduces intercreditor complexity and closing timeline, particularly valuable in competitive acquisition processes where speed is a differentiator.
- The equity contribution required in 2026 is materially higher than 2021. At 51.7% average LMM equity contribution in H1 2026, efficient gap-capital structuring is a strategic imperative, not an optimization exercise.
- Negotiate the full economic package, not just the spread. OID, upfront fees, PIK toggles, warrant coverage, call protection, and covenant headroom collectively determine the true cost of capital and the operational flexibility of the business post-close.


