
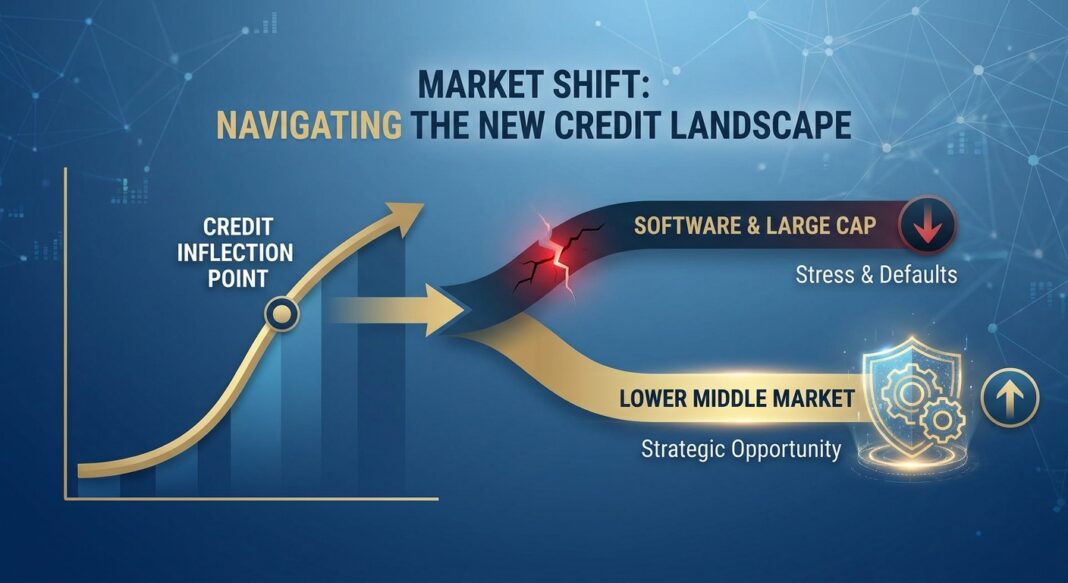
Market Headline: The Lender-Friendly Reset Is Here, But It Comes With a Credit Quality Warning
After years of relentless spread compression, surging AUM, and near-zero headline default rates, the private credit market has entered a definitive inflection point as of August 1, 2026. A confluence of forces (persistent Fed restraint, AI-driven disruption of the software sector, BDC redemption pressure, and a bank lending pullback now confirmed by two consecutive quarterly SLOOS surveys) has produced the most complex credit environment since 2020. The story is not one of systemic collapse, but of accelerating bifurcation: high-quality borrowers continue to clear at competitive terms, while marginal credits face wider spreads, tighter structures, and a rapidly shrinking pool of willing capital.
The headline from Morgan Stanley’s 2026 Midyear Outlook frames the dynamic well: “forward return potential is more attractive today than it was at the start of the year, supported by wider spreads, stable borrower fundamentals and growing financing demand.” Yet that optimism is tempered by hard data showing Proskauer’s Private Credit Default Index reaching 2.73% in Q1 2026: up from 1.84% just two quarters prior, and Fitch Ratings’ broader methodology placing the true U.S. private credit default rate at 5.8% for the twelve months through January 2026, the highest on record. For institutional investors and operators navigating this market, the imperative is precision: knowing which credits, sectors, and structures sit on which side of this widening divide.
Quantitative Market Snapshot
The table below consolidates the most current market metrics available as of August 1, 2026. All sources are linked directly.
| Metric | Current Value (Q2 2026) | Prior Period | Change | Source |
|---|---|---|---|---|
| Unitranche Spreads (Core Middle Market) | S+475–550 bps | S+450–525 bps (YE 2025) | +25 bps | Valuation Research Corp. |
| Lower Middle Market Spreads | S+475–525 bps (select deals: S+650–800) | S+450–500 bps (H2 2025) | Wider; +25–50 bps | PitchBook |
| High Yield Bond Spreads | ~250 bps | ~230 bps (Q1 2026) | +20 bps | Chicago Atlantic |
| Investment Grade Corporate Spreads | ~70 bps | ~65 bps (Q4 2025) | +5 bps | Chicago Atlantic |
| US Software Sector Leveraged Loan Spreads | ~950–1,000 bps | ~450–500 bps (YE 2025) | +~245 bps vs YE 2025 | Schroders / PitchBook LCD |
| Private Credit Default Rate (Proskauer Index, Q1 2026) | 2.73% | 1.84% (Q3 2025) | +89 bps | Forbes / Proskauer |
| Fed SLOOS: Net % Banks Tightening C&I Standards (Large & Mid-Market Firms) | +8.1% (net tightening) | Tighter (Q4 2025) | Consecutive tightening | Federal Reserve / FRED |
| Private Credit AUM (Corporate Lending) | >$2.1 trillion | ~$1.5 trillion (2025) | +40% YoY | ABF Journal |
Data as of June–July 2026 where available. Sources linked above. All-in yields on direct lending continue to generate high single-digit unlevered returns per Northleaf Capital, combining base rate (~3.5% SOFR forward curve average) plus spreads.
Sector Analysis: Software in Retreat, Lower Middle Market in Ascent
Software & Technology: The Epicenter of Credit Stress
No sector is generating more underwriting anxiety in mid-2026 than software. Schroders’ July 2026 Credit Lens, citing PitchBook LCD and ICE Data, shows US leveraged loan software spreads reaching new cycle highs of approximately 950–1,000 bps as of June 30, 2026, levels not seen since the pandemic. High yield software/services spreads have widened to approximately 550 bps, also near cycle highs. Valuation Research Corp. (VRC) notes that secondary B-rated software spreads are approximately 245 bps wider than year-end 2025 and roughly 229 bps above the broader B-rated loan index as of June 19, 2026, reflecting continued uncertainty related to AI-driven disruption. This matters structurally: the software industry represents roughly 40% of all sponsor-backed private credit loans, meaning sector-specific stress has outsized market-wide consequences. Lenders are now evaluating AI-impacted software borrowers on a strict case-by-case basis, with fixed charge coverage ratios (FCCR) and revenue retention metrics under intense scrutiny.
The Lower Middle Market: A Structural Opportunity Emerging
As institutional capital concentrates in larger, software-heavy transactions, the lower middle market (LMM) is attracting renewed attention. PitchBook reports LMM spreads of S+475–525 bps, with select deals reaching S+650 or even S+800, offering a meaningful premium over the commoditized upper-end market. Key structural advantages include stronger covenant packages, better lender protections, and less software correlation. Cliffwater data supports this view, consistently showing that lower-middle-market direct lending delivers 100–200 bps of yield premium over upper-middle-market direct lending, with comparable or lower realized loss rates due to less origination competition. LMM-focused BDCs (including CSWC, MAIN, and SAR) are reporting non-accruals below 1.5% at fair value through the 2024–2026 cycle, a stark contrast to their upper-market peers.
Healthcare, B2B Services & Industrials: Active Lender Appetite
Sectors demonstrating the most constructive lender reception in mid-2026 include healthcare services, business-to-business (B2B) services, transportation & logistics, and select industrials. Lafayette Square reports deal activity gaining traction across Business Services, Tech & Telecom (hardware-focused), Healthcare & Franchising, and Transportation & Logistics. Aging demographics are driving sustained demand for healthcare-adjacent LMM deals, while the B2B services segment benefits from recurring revenue models that support more predictable FCCR underwriting. Healthcare’s rise relative to software’s retreat may, per Sikich, prove to be more than a temporary rotation.
Bank Tightening Amplifies Private Credit’s Role: With a Caveat
The Federal Reserve’s April 2026 SLOOS confirms that banks reported tighter C&I lending standards for firms of all sizes in Q1 2026, with the net tightening share for large and middle-market firms reaching 8.1% (per FRED). Critically, banks also reported tighter standards across all categories of loans to non-depository financial institutions (NDFIs) over the past year, a direct constraint on the warehouse lines and leverage facilities that power private credit fund operations. This dynamic simultaneously creates new origination opportunity for well-capitalized private lenders while raising their own cost of capital.
Implications for Institutional Investors & Business Operators
For Borrowers
The credit market of mid-2026 is unambiguously bifurcated. Sikich’s Q2 2026 Credit Market Update notes that no direct-lender LBO over $2 billion has closed since early March, while spreads on standard transactions have widened 25 to 50 basis points as lenders reset terms. High-quality borrowers with demonstrable FCCR headroom (generally >1.5x), diversified revenue, and limited AI disruption exposure continue to access capital at competitive all-in yields. Operators in software or technology services must now present compelling evidence that their revenue model is defensible against AI substitution, a bar that is rising rapidly. For LMM borrowers, the environment is counter-intuitively improving: lenders entering the segment bring new capital, though they also bring higher diligence standards, including more private equity-style operational underwriting.
For Investors & Lenders
Morgan Stanley’s 2026 Midyear Outlook argues that the spread reset creates a stronger return foundation than existed at year-start. Lord Abbett confirms spreads are roughly 50 to 100 basis points higher since late 2025 (per PitchBook data as of March 31, 2026), with defensive documentation terms also improving. However, investors must discount headline default figures. Fitch Ratings’ broader methodology shows the true U.S. private credit default rate at 5.8% for the twelve months through January 2026: the highest since Fitch began tracking it, compared to the ~2% headline rate that excludes distressed exchanges and liability management exercises. Portfolio managers with robust workout infrastructure and concentrated LMM or non-software exposure are now separating from the pack. Morgan Stanley also highlights growing institutional demand from pension plans and insurers attracted by income generation and diversification in a higher-rate environment, even as BDC net flows moderate.
KPI Thresholds Under Active Lender Review
Current underwriting conversations are centering on three KPI thresholds. First, FCCR floors are being reasserted at ≥1.35x for most core middle market transactions, with software deals requiring ≥1.50x given ARR retention risk. Second, senior leverage multiples in direct lending are being held at or below the weighted average portfolio level of approximately 5.2–5.3x at commitment (per Onex Direct Lending BDC Q2 2026 10-Q), with loan-to-value ratios held near 44%. Third, PIK usage is being scrutinized as a credit quality signal: public BDCs are now receiving an average of 8% of investment income via PIK, a level that regulators and institutional investors are monitoring closely as a proxy for masked cash flow stress.
Forward-Looking View: Liquidity & Lending Dynamics (H2 2026–H1 2027)
The next 3–6 months will be defined by three dynamics playing out in parallel:
1. The Maturity Wall & Refinancing Test. A $162 billion maturity wall must be refinanced this year at materially higher costs than when originally underwritten. Unlike prior years, lender appetite to extend terms has soured, meaning a proportion of these borrowers, particularly in software, will face genuine distress rather than amend-and-extend relief. This creates an expanding opportunity set for distressed and special situations strategies.
2. PE Overhang Fueling Flexible Capital Demand. Morgan Stanley estimates that by 2029, the net value of unsold PE assets at the end of their 12-year theoretical life could nearly double to $903 billion. Private credit’s “flexible capital” or solutions-oriented strategies, hybrid structures outside traditional direct lending, are responding to the liquidity needs of fundamentally sound but exit-constrained assets. NAV lending margins in the mid-market remain in a 520–660 bps band (per Nodem NAV Financing Update, Mid-Year 2026), with 90% of H1 2026 borrowers electing PIK interest to preserve portfolio cash flow.
3. Institutional Capital Rotation Continues. Despite BDC redemption pressure, long-term institutional allocators (pension plans and insurers) continue to increase exposure to private credit. Morgan Stanley characterizes this as durable demand supported by the asset class’s income profile and risk-adjusted returns in a higher-rate environment. Simultaneously, private credit CLO issuance has remained resilient: per PitchBook, middle-market CLOs totaled $17.3 billion through mid-June 2026, in line with the same period in 2025, while the broader private credit CLO market reached approximately $155 billion outstanding as of October 2025.
Key Market Insights
- Spread reset is real and accelerating: Core middle market unitranche spreads are 25–50 bps wider since year-end 2025, with software-sector loans reaching new cycle highs of 950–1,000 bps. The spread widening is restoring lender economics that compressed through 2023–2025 and creating a stronger forward return environment for disciplined allocators.
- True default rates are materially higher than reported: Fitch’s broad methodology places the private credit default rate at 5.8% (through January 2026), while Proskauer’s index hit 2.73% in Q1 2026. PIK income averaging 8% of BDC investment income is masking deeper cash flow stress. Investors should demand transparent stress-testing of FCCR floors and PIK-adjusted coverage metrics.
- Bank tightening is structural, not cyclical: Two consecutive SLOOS surveys confirm tighter C&I standards for firms of all sizes, with the net tightening share for large/mid-market firms at 8.1% in Q2 2026. Banks are also tightening warehouse and NDFI credit lines that fund private lenders, compressing the arbitrage available to undercapitalized managers.
- The lower middle market is the highest-conviction structural opportunity: LMM spreads of S+475–525 bps (with select deals at S+800), superior covenant packages, lower software correlation, and non-accrual rates below 1.5% at LMM-focused BDCs make this segment the most attractive risk-adjusted entry point for H2 2026 deployment.
- Sector and manager selection are paramount: Healthcare services, B2B services, transportation & logistics, and franchising show active lender appetite. Software and AI-adjacent SaaS credits face structural headwinds that will persist beyond any single rate cycle. Manager differentiation (particularly workout capability, portfolio monitoring, and LMM origination infrastructure) is now a primary performance driver.


