
The Underwriting Question Every Lender Must Answer
A sponsor model lands in your inbox. The cover page announces a $10M EBITDA manufacturing company, 4.5x total leverage, seasoned management team, stable end markets. The ask: a $45M senior secured term loan to fund a sponsor-backed buyout. The credit committee slot is in 72 hours.
Before you underwrite a single turn of leverage, you need to answer one foundational question: Is this EBITDA real?
Adjusted EBITDA is simultaneously the most important metric in private credit underwriting and the most susceptible to manipulation. It drives the leverage ratio, the interest coverage test, the total enterprise value, and, if things go wrong, the recovery calculation. Get it wrong at origination and every downstream risk calculation is built on a false foundation.
As Sidley Austin’s 2026 review of private credit documentation makes clear, sidley.com, common add-backs in negotiated credit agreements now routinely include restructuring costs, transaction expenses, pro forma synergies, run-rate adjustments, and company-specific items, each category a potential vector for earnings inflation. And according to PitchBook’s 2026 market analysis, pitchbook.com, private credit deals have historically included EBITDA adjustments averaging 20% to 30% of total EBITDA. A 25% adjustment on a $10M EBITDA company means $2.5M of earnings that may never materialize, and at a 5x multiple, that is $12.5M of enterprise value that does not exist.
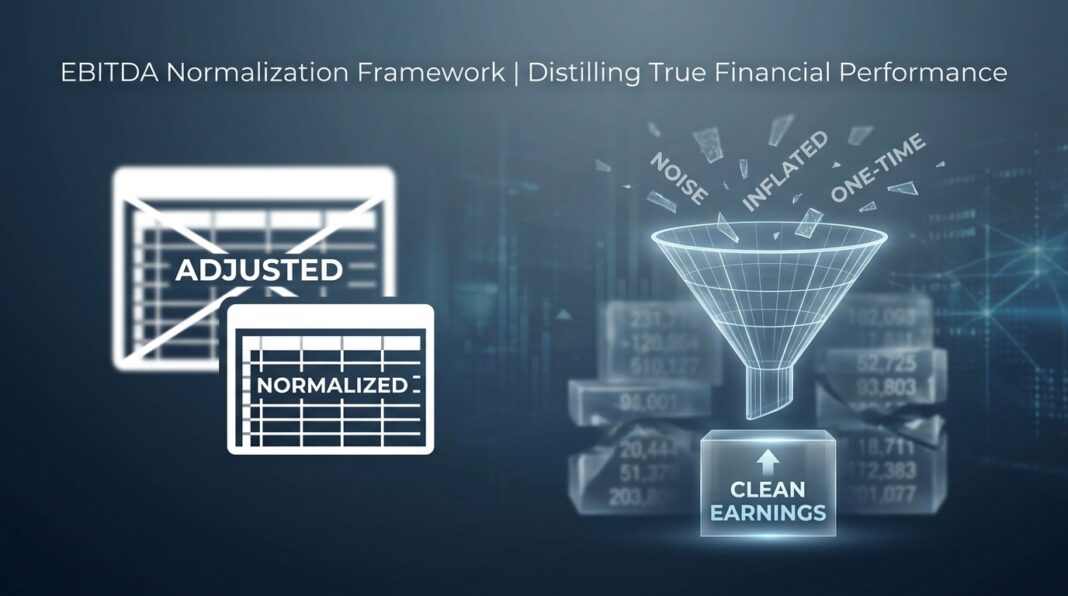
The discipline of EBITDA normalization is where underwriting rigor either holds or collapses. This framework teaches you how to hold it.
The Normalization Framework: From Reported Earnings to Underwritten EBITDA
Normalized EBITDA is not a GAAP measure. It is a practitioner construct, a lender’s best estimate of the sustainable, recurring operating cash earnings a business will generate under normalized conditions. As Auxo Capital Advisors explains, auxocapitaladvisors.com, normalized EBITDA differs from reported EBITDA because it adjusts for items that distort a company’s recurring earnings power.
Lenders must work through this construction in four sequential layers:
Layer 1: The Reported Baseline
Start with audited or reviewed financials. Use a trailing twelve-month (TTM) period, not a fiscal year end that may understate recent deterioration or overstate recent one-time gains. Reconcile from GAAP net income upward: add back interest expense, income taxes, depreciation, and amortization to arrive at reported EBITDA. This is your untouched starting point.
Layer 2: Owner and Structural Normalization
Private and sponsor-backed businesses frequently carry non-arm’s-length expenses that a new ownership structure would eliminate or restructure. These include: above-market owner compensation (add back only the delta above a market-rate replacement salary); personal expenses run through the business (aircraft, real estate, family payroll); and related-party rents or management fees not at market. These adjustments are generally defensible if documented.
Layer 3: Non-Recurring Item Analysis
This is where lender discipline separates disciplined shops from credulous ones. nxtcapital.com is unambiguous: unjustified add-backs can hide the true level of leverage, and astute lenders must analyze and challenge EBITDA adjustments line by line. Common items presented as non-recurring include: litigation settlements, facility closure costs, severance, system implementation fees, and one-time consulting engagements. The analytical test is strict, has this category of expense recurred in any of the trailing three years? If yes, it is not non-recurring; it is a structural operating cost. Layer 3 add-backs require source documentation and a written rationale for each item.
Layer 4: Pro Forma and Run-Rate Adjustments
The highest-risk layer. Pro forma synergies (cost savings from a completed or planned acquisition), run-rate revenue from contracts signed but not yet generated, and headcount reductions not yet implemented all require future performance to validate. Sidley’s 2026 analysis notes that sidley.com lenders often impose caps, expressed as a percentage of EBITDA, on projection-based or nonrecurring adjustments to prevent earnings inflation from reaching into the leverage test. A best-practice cap is 15–20% of adjusted EBITDA for all uncertified run-rate items combined. Any add-back above that cap should require third-party QoE support, a signed contract, or a demonstrable cost reduction already reflected in recent payroll data.
Walking the Calculation: A $10M EBITDA Manufacturing Case
Consider the following sponsor model submission for a Midwest precision-parts manufacturer (all figures illustrative, built from published market norms):
| Line Item | Sponsor Model ($000s) | Lender-Adjusted ($000s) | Disposition |
|---|---|---|---|
| Reported EBITDA (TTM) | $7,800 | $7,800 | Baseline |
| Owner Excess Compensation | +$500 | +$350 | Partial, market-rate replacement at $300K applied |
| One-Time Legal Settlement | +$400 | +$400 | Accepted, single event, documented |
| ERP System Implementation | +$300 | +$0 | Rejected, recurred in 2 of 3 prior years |
| Pro Forma Synergies (acquisition) | +$800 | +$250 | Haircut to 31%, no integration plan submitted |
| Run-Rate Revenue (new contract) | +$200 | +$0 | Rejected, contract unsigned at time of submission |
| Underwritten EBITDA | $10,000 | $8,800 | 12% gap |
The impact on the leverage calculation is material. At a $45M senior term loan:
- Sponsor leverage: $45M ÷ $10.0M = 4.50x
- Lender-adjusted leverage: $45M ÷ $8.8M = 5.11x
At 5.11x, this transaction is approaching the threshold flagged by the Federal Reserve’s interagency guidance on leveraged lending, federalreserve.gov, which notes that a leverage level in excess of 6x Total Debt/EBITDA raises concerns for most industries, but the more relevant internal threshold for senior-only structures is typically 5.0–5.5x. A 0.6-turn discrepancy in EBITDA normalization can be the difference between a pass and a hold.
Equally important: run the interest coverage ratio against the lender-adjusted figure. At a blended all-in rate of 10% (SOFR + spread), annual interest expense on $45M is approximately $4.5M. EBITDA-to-interest coverage = $8.8M ÷ $4.5M = 1.96x: well within a minimum 1.5x threshold, but not with the cushion the sponsor model implied.
What the Market and Institutional Lenders Are Watching in 2026
The macro environment in 2026 has made EBITDA normalization more consequential, not less. According to Morgan Stanley’s 2026 private credit outlook, morganstanley.com, EBITDA-to-interest coverage ratios have moved modestly higher, with mean consensus forecasting an EBITDA rebound among leveraged loan borrowers. But coverage improvement should not give underwriters false comfort, quality of that EBITDA matters as much as its magnitude.
A February 2026 Proskauer report on private credit documentation, proskauer.com, found that a majority of deals (57%) now include revenue adjustments, a significant expansion of the add-back perimeter. The same report observed that independent due diligence certifications on those adjustments are declining, creating a gap between what is being added back and what is being independently verified.
The Financial Stability Board’s May 2026 report on private credit vulnerabilities, fsb.org, flags that while some EBITDA adjustments may be warranted to reflect cost savings or future synergies, previous research in the leveraged loan market has shown that most adjustments do not materialize at the level projected. This systemic finding should be the lender’s prior: treat add-backs as an aggressive estimate, not a conservative one.
Partners Group’s Q1 2026 market analysis, partnersgroup.com, provides encouraging portfolio-level context: the share of borrowers with sub-1.0x interest coverage has fallen to 14% in Q4 2025 from 21–23% in 2023–2024, and non-accrual rates have declined to approximately 1.3% of cost. Average LBO equity contributions at origination have reached approximately 50%, up from ~35% a decade ago, providing lenders with a larger equity cushion in downside scenarios.
📊 Credit Performance Data Box
- U.S. leveraged loan default rate (December 2024): 1.45%, per S&P Global Ratings
- First-lien senior secured loan recovery rate (ultimate, long-term): ~71% for term loans and ~87% for revolving credit facilities, per Moody's data via BMA
- Cov-lite expected recovery (Moody's estimate): ~50% for first-lien-only cov-lite structures vs. ~65% when covenants are present, per bancalliance.com
- BDC non-accrual rate (Q4 2025): ~1.3% of cost, below post-GFC average, per Partners Group
- Private credit EBITDA adjustments (historical average): 20–30% of total EBITDA per deal, per PitchBook
- Deals with revenue add-backs (2025 European private credit): 57% of transactions, per Proskauer 15th Annual Private Credit Report
- Shadow default rate (deals requiring amended conditions mid-term): rose from 2.5% to 6.4% over a recent 12-month period, per Yahoo Finance / market data
PitchBook’s 2026 market reporting, pitchbook.com, documents a meaningful tightening in sector-specific EBITDA underwriting: lenders are increasingly skeptical of pro forma EBITDA or run-rate revenue that has yet to materialize, particularly in software, where EBITDA adjustments previously accepted are now drawing greater scrutiny. Among eight software loans placed by Lincoln International in early 2026, none were structured as annual recurring-revenue loans. The sector-level shift reflects a broader principle: EBITDA normalization must be calibrated to business model durability, not just income statement arithmetic.
Underwriting Checklist: EBITDA Normalization Diligence
Use this framework at origination and at each annual review:
☐ Step 1: Obtain Source Financials
- Request CPA-reviewed or audited statements for the trailing three fiscal years plus TTM
- Obtain monthly management accounts for the most recent 12 months, seasonality masking is common in annual figures
- Compare tax returns to financial statements; unexplained divergences are a red flag
☐ Step 2: Build the Independent EBITDA Bridge
- Start from GAAP net income, not the sponsor’s adjusted EBITDA line
- Reconstruct reported EBITDA yourself using company financials before reviewing sponsor adjustments
- Compare your reported baseline to the sponsor’s, any unexplained gap requires explanation
☐ Step 3: Stress-Test Each Add-Back Category
- Non-recurring items: Does the GL show this category in any of the trailing 3 years? If yes, reject or treat as recurring
- Owner compensation: Obtain comp benchmark data; add back only the above-market delta, not total compensation
- Pro forma synergies: Require a written integration plan, timeline, and responsible party; apply a 50–70% haircut absent a completed integration
- Run-rate revenue: Accept only if the underlying contract is executed, the customer is onboarded, and revenue has commenced
- Cost savings: Validate through payroll registers or vendor termination notices, not management representations alone
☐ Step 4: Apply Add-Back Caps
- Total uncertified pro forma / run-rate adjustments should not exceed 15–20% of adjusted EBITDA
- Flag any transaction where the reported-to-adjusted gap exceeds 25% for enhanced IC scrutiny; this range is identified as signaling aggressive add-backs by market practitioners, per iconic.co
☐ Step 5: Commission or Review Third-Party QoE
- For transactions above $25M, require an independent Quality of Earnings report from a credentialed accounting firm
- Review the QoE scope: confirm it covers revenue quality, customer concentration, working capital normalization, and add-back support
- Identify any items the QoE firm flagged but the sponsor did not disclose
☐ Step 6: Rebuild Credit Metrics on Lender-Adjusted EBITDA
- Total Debt / Lender-Adjusted EBITDA: target <5.0x for senior-only structures (flag >6x per federalreserve.gov guidance)
- EBITDA / Cash Interest Expense: minimum 1.5x; target 2.0x+
- Fixed Charge Coverage Ratio (FCCR): minimum 1.1x inclusive of capex, taxes, and scheduled amortization
- Test all three ratios under a downside scenario: reduce lender-adjusted EBITDA by 20–25% and confirm the credit still services debt
☐ Step 7: Document the Normalization Memo
- Prepare a written EBITDA bridge showing every add-back, the source document reviewed, the lender’s disposition, and the rationale
- This memo becomes part of the credit file and the basis for covenant-setting at origination
Key Takeaways
- EBITDA is a negotiated construct, not a fact. Private credit deals have historically included EBITDA adjustments averaging 20–30% of total EBITDA; lenders who accept sponsor models without independent reconstruction are underwriting fiction, not fundamentals.
- The reported-to-adjusted gap is a signal, not just a number. A gap exceeding 25% is a documented warning sign for aggressive add-backs, treat it as a diligence trigger, not an underwriting starting point.
- Pro forma and run-rate items carry the highest risk. These adjustments require future performance to validate. Apply caps (15–20% of adjusted EBITDA), demand documentation, and haircut synergies aggressively absent a completed integration plan.
- Every add-back has a recovery implication. Inflated EBITDA understates true leverage and erodes the equity cushion that protects senior lenders. Per Moody’s data, cov-lite first-lien-only structures recover approximately 50% in default, 15 percentage points below the recovery rate when covenants are present. Rigorous EBITDA underwriting is the first line of recovery protection.
- Normalization discipline is portfolio discipline. As the FSB’s May 2026 report warns, most pro forma adjustments in the leveraged loan market have historically not materialized at projected levels. Systematic overstatement of EBITDA at origination creates a portfolio-wide leverage problem that only surfaces when credit conditions tighten. Build the underwriting standard that survives a cycle, not just a credit committee.


