
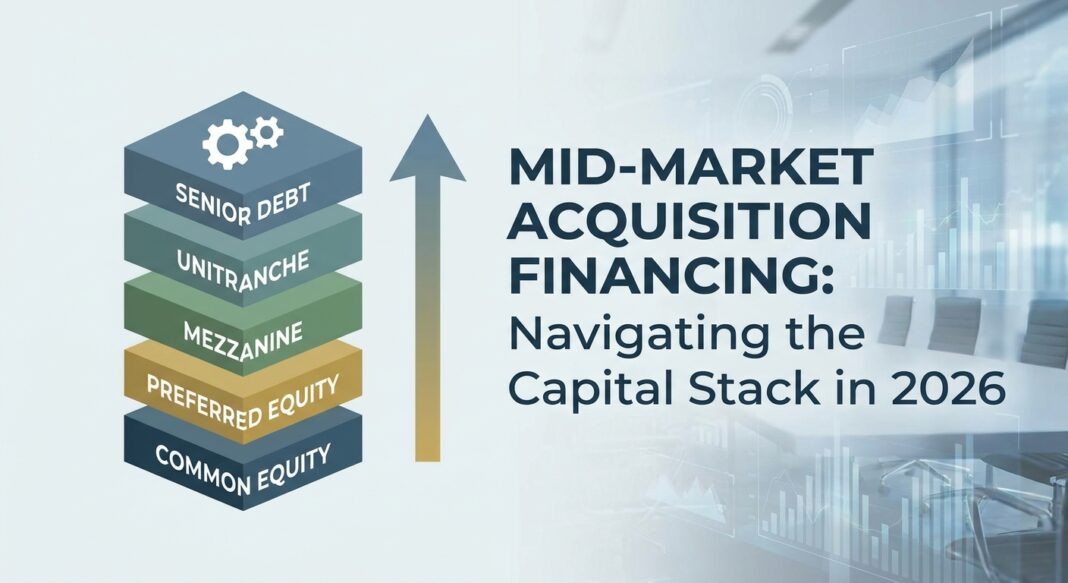
The Financing Challenge: Growth-Stage Acquisition Capital
A business generating $8–12M in EBITDA, with a clean balance sheet and a clear acquisition target, sits at one of the most consequential decision points in its lifecycle. The company is too large for SBA-only financing and too small for a broadly syndicated loan. Its owner is profitable, strategically ready, and capital-constrained. This is the growth-stage acquisition gap, and it plays out thousands of times per year across the American middle market.
The question is never simply “where do we get the money?” It is: which layer of the capital stack, at what cost, with what control consequences, and structured how? Get it right and the acquisition accelerates the business toward an exit multiple materially above today's value. Get it wrong (by overpaying for equity, over-leveraging the balance sheet, or accepting punitive covenants) and the deal that was supposed to be transformative becomes a drag on operations within 18 months.
This article walks through the full cost-of-capital spectrum available to a growth-stage operator in 2026, maps each instrument to its appropriate use-of-proceeds, and provides a tactical playbook for structuring, running, and closing the right deal.
Mapping the Cost-of-Capital Spectrum: Banks to Equity
Every acquisition financing decision begins with the same five-layer map. Understanding where each instrument sits (and what it costs) is the foundation of any structuring conversation.
| Layer | Instrument | Typical Cost (2026) | Leverage | Key Trade-Off |
|---|---|---|---|---|
| 1, Senior Secured | Bank revolver / term loan | SOFR + 200–350 bps | 2.5–3.5x EBITDA | Lowest cost; tightest covenants; limited stretch |
| 2, Unitranche | Direct lending (single tranche) | SOFR + 500–700 bps (9.5–11% all-in) | 4–6x EBITDA | Speed and simplicity; higher cost than bank split |
| 3, Mezzanine / Junior Debt | Sub-debt with PIK + warrant | 12–20% (cash + PIK blended) | Up to 6–7x total | Extends leverage; equity dilution via warrants |
| 4, Preferred Equity | Growth equity / minority PE | 15–25% IRR target | N/A (equity) | Non-dilutive to operations; preference stack + board rights |
| 5, Common Equity | Sponsor rollover / operator equity | Residual upside | N/A | Highest cost of capital; aligned incentives |
In practice, most mid-market acquisitions in the $25M–$200M enterprise value range are financed not from a single layer but from a blended stack. The operator's job is to understand which layers they can access, what each costs on a blended basis, and where the structural trade-offs are most consequential.
Structure Breakdown: The Unitranche as the Growth-Stage Default in 2026
For acquisitions in the $25M–$200M enterprise value range, the unitranche has become the structural standard. It collapses what would otherwise be a senior term loan and a mezzanine tranche into a single credit agreement with one lender, one covenant package, and one closing process.
Illustrative Term Sheet: $55M Unitranche for a $110M EV Healthcare Services Platform
- Enterprise Value: $110M (target acquisition)
- EBITDA (LTM adjusted): $11M
- Total Leverage: 5.0x EBITDA ($55M unitranche)
- Pricing: SOFR + 575 bps (current SOFR ~5.3%; all-in ~10.85%)
- OID: 2.0% ($1.1M upfront fee, amortized)
- Maturity: 6 years (bullet)
- Amortization: 1% per annum (PIK-eligible in years 1–2 at lender discretion)
- Prepayment: 3% / 2% / 1% call protection (years 1–3)
- Financial Covenant: Single maintenance test, minimum Total Net Leverage ≤ 5.75x, tested quarterly with 10% equity cure right
- Equity Contribution: $33M (30% of EV), contributed by operator + co-investor family office
- Revolver: $5M super-senior RCF alongside unitranche (unfunded at close)
The blended all-in cost on this structure is approximately 11.2% including OID amortization. A traditional bank senior / mezzanine split at the same leverage would likely price the senior at SOFR + 275 bps and the mezzanine at 13–16% (partially PIK), producing a similar or slightly higher blended cost, but requiring two credit agreements, two diligence processes, and an intercreditor negotiation that adds 30–60 days to close.
The speed premium is real and quantifiable. A unitranche can close 30 to 45 days faster than a syndicated alternative, and sponsors often justify the additional spread by avoiding broken syndications or delayed closings that jeopardize purchase agreements.
How It Compares: Unitranche vs. Senior + Mezz Split vs. Equity-Heavy Stack
Option A: Unitranche (Single Lender, SOFR + 500–700 bps)
The unitranche dominates the lower-middle-market direct lending channel in 2026, with roughly 70–80% of deals in the $25M–$200M EV range using it as at least the primary debt component. The advantages are structural: one negotiation, one closing, one lender to manage post-close, and no intercreditor agreement to fight over if the business underperforms. The disadvantage is price, unitranche lenders typically sit 150–250 bps wide of a comparable senior bank loan for the same senior-secured risk.
Option B: Bank Senior + Mezzanine (Two-Tranche Split)
The traditional split structure (2.5–3.5x senior from a bank, 1.5–2.5x mezzanine from a fund) still makes sense when the operator has an existing banking relationship, values lower senior pricing, and has the timeline to run a parallel two-lender process. Mezzanine in 2026 carries a cash coupon of 10–14% plus PIK toggling rights and, frequently, equity warrants covering 1–5% of the company on a fully diluted basis. Recovery rates on mezzanine are typically 50–70% versus 70–90% for senior debt, which explains the higher required return.
Option C: Equity-Heavy Stack (Lower Leverage, Minority PE)
Growth-capital raises in 2024–2026 have increasingly stacked minority equity with a senior credit facility, sometimes adding a mezzanine layer, to keep dilution below 30% while still funding the acquisition or growth plan. This structure makes sense when the business cannot support 4–5x leverage (cyclical revenues, asset-light model, high customer concentration) or when the operator wants a strategic partner over a pure lender. The cost is equity dilution and preference stack exposure.
The governing rule: match the instrument to the cash flow profile of the use-of-proceeds. Stable, recurring revenue supports leverage. Cyclical or project-based revenue demands more equity cushion.
Current Market Terms: What the Data Shows in Mid-2026
The private credit market has reset in a more lender-friendly direction heading into the second half of 2026. After a prolonged period of spread compression driven by excess dry powder chasing limited deal flow, the market is recalibrating toward tighter documentation, more selective underwriting, and wider spreads for marginal credits. Here are the structural benchmarks operators should be working from:
- Unitranche pricing (upper middle market, sponsored): SOFR + 425–475 bps per Capstone Partners’ Winter 2025 Leveraged Finance Report; core middle market credits command an additional 50–100 bps premium.
- Unitranche pricing (lower middle market, $10M EBITDA target): SOFR + 500–650 bps is the working 2026 band per Lincoln International's Q1 2026 Senior Debt data; all-in costs of 9.5–11% on a typical 5x leverage deal.
- OID: Average OID on private credit deals ran approximately 2–3% of funded principal in recent periods, with unitranche-specific OID reflecting similar ranges in current documentation.
- PIK usage: Payment-in-kind is no longer confined to mezzanine. Public BDCs now receive an average of 8% of investment income via PIK, and PIK is increasingly appearing in senior secured loan documentation, a trend borrowers should monitor carefully as a signal of credit stress normalization.
- Covenant structure: Most middle market unitranche facilities retain at least one financial maintenance covenant, typically a total leverage test or fixed charge coverage ratio (FCCR), even as covenant-lite structures proliferate in the broadly syndicated loan (BSL) market. Unitranche funds accept lower covenant thresholds (often FCCR 1.10x) versus regional banks (FCCR 1.25–1.35x), but demand higher pricing and tighter reporting.
- Private credit AUM: The private credit market is projected to reach approximately $1.96 trillion in 2026, with Moody's forecasting AUM exceeding $2 trillion this year and approaching $4 trillion by 2030, reinforcing the depth of capital available but also the increasing selectivity of top-tier lenders.
- Refinancing wall: Approximately $657 billion of middle market loans are expected to mature between 2026 and 2031, creating a significant refinancing overhang that will pressure spreads for stressed credits but create opportunities for well-prepared borrowers to refinance into better terms.
The Covenant Design Decision
Maintenance covenants require borrowers to continuously satisfy financial tests at regular intervals, typically quarterly, regardless of any specific action or transaction. They function as trip wires: even if a borrower's business is fundamentally sound, temporary underperformance can trigger violations that shift negotiating power to lenders. Incurrence covenants, by contrast, are transaction-gating tools; they only apply when the borrower takes a specific action, such as incurring additional debt, making acquisitions, or paying dividends.
For borrowers, the practical implication is this: maintenance covenants give lenders earlier intervention rights, while incurrence covenants provide more operational runway. In leveraged buyout and unitranche documentation, borrowers should push to limit maintenance tests to a single leverage or coverage ratio, negotiate meaningful equity cure rights (typically 10% of tested EBITDA), and ensure headroom of at least 20–25% above expected performance at close.
The Gap Capital Playbook: Quantify → Prepare → Run the Process → Negotiate
Step 1: Quantify the Gap
Before approaching any lender, the operator must define the capital gap with precision. This means calculating: (a) total sources and uses for the transaction, (b) maximum supportable leverage at conservative EBITDA assumptions (not management's upside case), (c) the equity contribution available from existing cash and co-investors, and (d) the residual gap that must be filled by debt capital. A typical $8M–$60M EV deal in 2026 pulls senior debt from an SBA 7(a) lender or a regional bank, junior capital from a mezzanine fund or unitranche provider, and equity from a private equity sponsor, family office, independent sponsor, or the buyer's own rollover.
Step 2: Prepare the Materials
Lenders underwrite to the quality of the information package. A Confidential Information Memorandum (CIM) for a mid-market acquisition financing should include: (a) three years of audited or reviewed financials plus a quality-of-earnings (QoE) summary, (b) a detailed EBITDA bridge reconciling reported earnings to adjusted figures (EBITDA adjustments rebounded to 10.88% of deal EBITDA in Q1 2025 M&A transactions: expect scrutiny), (c) a customer concentration analysis, (d) a use-of-proceeds waterfall, and (e) a go-forward operating plan with debt service coverage projections at base, downside, and stress scenarios. Documentation and coordination challenges consistently rank as a leading cause of delayed closings, operators who front-load diligence prep compress timelines materially.
Step 3: Run a Competitive Process
A bilateral negotiation with a single lender produces one term sheet, drafted entirely by the lender's counsel, with no competitive tension on pricing or structure. A curated process of 20–40 targeted lender outreach contacts produces multiple term sheets and meaningful negotiating room on spread, OID, covenant design, and prepayment penalties. Buyers who compress the process by not running parallel senior and junior lender tracks routinely give up 200–400 bps of pricing and 5–10 points of equity. The process for a typical mid-market acquisition financing runs 90–180 days across nine phases: target identification, IOI or LOI, capital strategy design, CIM preparation, lender outreach, term sheet negotiation, quality of earnings and legal diligence, definitive documentation, and funding and close.
Step 4: Negotiate the Structure
The most negotiable terms (and where borrowers leave the most value on the table) are not the headline spread. They are:
- OID and upfront fees: Lender counsel fees on a $50M LMM unitranche can reach $600K–$1.2M if uncapped; a hard cap of $250K–$400K is negotiable and considered market in 2026.
- Prepayment penalties: Standard call protection runs 3%/2%/1% over the first three years. Operators expecting a near-term refinancing or sale should negotiate for a faster step-down or a par call after year two.
- MFN protections: Lender-friendly most-favored-nation clauses trigger repricing if the borrower raises subsequent debt at wider spreads. In competitive term sheet rounds, LMM lenders will often drop MFN protections entirely if pushed.
- Equity cure rights: Negotiate for a minimum of two equity cure events per fiscal year, with cure amounts counted toward the tested period EBITDA.
- Incremental facilities: Ensure the credit agreement includes a clearly defined incremental basket (typically the greater of a fixed dollar amount or 0.5x EBITDA) to preserve the ability to finance add-on acquisitions without triggering a full amendment.
Structuring Guidance: For Operators and Investors
For Operators
Treat the capital structure as a strategic asset, not a financing afterthought. The right structure preserves optionality: the ability to refinance if rates fall, to execute add-on acquisitions without triggering amendment fees, and to recapitalize ahead of an exit. A growth-stage operator who accepts punitive call protection, a tight leverage maintenance covenant with no cure right, or an MFN clause without pushback has traded long-term flexibility for short-term closing convenience. Run a competitive process even if you have a preferred lender relationship. The discipline of a process produces better outcomes (on price, on covenant design, and on lender behavior post-close) than bilateral negotiation every time.
For Investors and Co-Lenders
When evaluating a growth-stage acquisition capital stack, focus less on the headline leverage multiple and more on the quality of EBITDA and the covenant architecture. Interest coverage ratios in private credit averaged just 2.3x in 2025, a record low, and approximately 40% of private credit borrowers carried negative free cash flow as of the IMF's 2025 Financial Stability Report, up from 25% in 2021. The margin of safety in 2026 unitranche underwriting is thinner than headline multiples suggest. Lenders with strong maintenance covenant packages and meaningful cure right limitations retain the intervention rights needed to protect recovery in a stress scenario.
Key Takeaways
- The unitranche is the 2026 default for $25M–$200M EV acquisitions, pricing at SOFR + 500–700 bps (9.5–11% all-in) with 4–6x total leverage and a single covenant package, but its speed and simplicity premium is real and measurable.
- Covenant design is a control-rights decision, not just a compliance exercise. Maintenance covenants give lenders earlier intervention rights; incurrence covenants provide operational runway. Borrowers should push for a single maintenance test, 20–25% headroom at close, and meaningful equity cure rights.
- PIK is migrating up the capital stack. Once confined to mezzanine, PIK toggle features are appearing in senior secured documentation, a structural signal that borrowers in stressed situations are increasingly preserving cash at the expense of compounding debt.
- Process discipline creates alpha. Operators who run a competitive 20–40 lender process rather than bilateral negotiation recover 200–400 bps of pricing and 5–10 points of equity versus those who do not.
- The refinancing wall is an opportunity. Approximately $657 billion of middle market loans mature between 2026 and 2031. Well-prepared borrowers with clean balance sheets, strong EBITDA quality, and competitive processes will be able to refinance into more favorable terms (lower spreads, lighter covenants, and longer tenors) as lenders compete for high-quality credits.


