
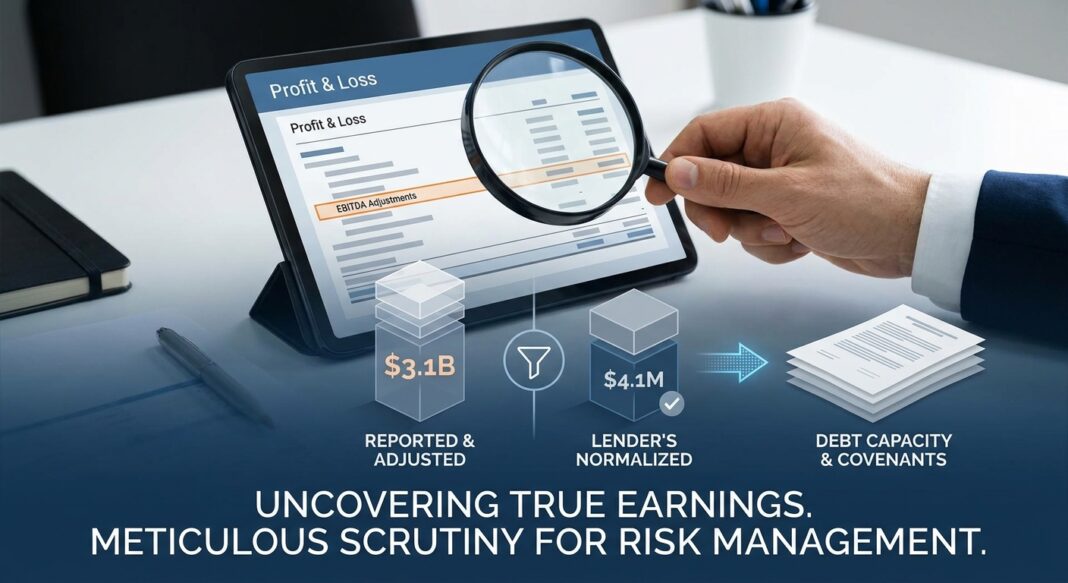
The Underwriting Question Every Lender Must Answer First
Before a leveraged loan is priced, before a covenant is structured, before a dollar of debt capacity is sized; there is one number that determines everything: Adjusted EBITDA. It is the foundation upon which leverage ratios are calculated, covenants are set, and enterprise value is argued. It is also the number most likely to be wrong.
Every dollar of inflated or unjustified Adjusted EBITDA has a disproportionate impact on valuation and deal returns. (PKF O’Connor Davies) In a market where transactions are priced at 5x to 6x EBITDA, a single $500K add-back that a lender refuses to credit can move enterprise value by $2.5M to $3M, and collapse debt capacity in the same stroke.
The challenge for underwriters is not arithmetic. It is judgment: distinguishing recurring from non-recurring, economic reality from financial engineering, and a defensible adjustment from a motivated one. In today’s direct lending environment, where the bridge between reported and adjusted EBITDA is no longer just a meme-worthy punchline, but a red flag in the eyes of investors and diligence teams (PKF O’Connor Davies, 2025), getting this wrong is not a technical error. It is a credit event waiting to happen.
This article provides Bond Capital’s practitioner framework for dissecting EBITDA adjustments with the rigor that institutional underwriting demands.
The Analytical Framework: Adjusted vs. Normalized EBITDA
Many practitioners use the terms interchangeably, but experienced underwriters draw a sharp distinction. Adjusted EBITDA is the bridge from reported financials to a cleaned-up earnings number after removing one-time and non-operating items. Normalized EBITDA goes further to reflect the earnings a buyer can sustainably underwrite after considering steady-state staffing, market compensation, and necessary reinvestment. (Windsor Drake) Critically, normalized EBITDA can be lower than adjusted EBITDA when the business requires additional costs under new ownership. (Windsor Drake)
This distinction is not semantic. A lender sizing debt to adjusted EBITDA of $12M may be extending credit against a run-rate that the business cannot actually sustain. The underwriter’s job is to construct a lender’s own normalized EBITDA: independently, from the ground up, and test it against the sponsor’s presentation.
The Five-Step Normalization Process
- Start with Reported EBITDA (trailing 12 months): Pull from audited or reviewed financials and reconcile to management accounts. Buyers rely on the most recent information, specifically the trailing 12-month (TTM) period for setting value and for debt financing underwriting. (Baker Tilly) A QoE report examines adjusted numbers on a monthly basis rather than annual, providing greater accuracy on trend and seasonality.
- Build the Adjustment Bridge: The most common add-backs include excess owner compensation above market replacement cost, owner perks and discretionary personal expenses run through the business, one-time legal settlements and lawsuit costs, transaction-related expenses, non-recurring severance and restructuring costs, and related-party rent or management fee normalization. (Windsor Drake) Each category requires independent documentation: tax returns, general ledgers, board minutes, and third-party invoices.
- Apply the Lender’s Skepticism Filter: Lenders independently evaluate normalized EBITDA during underwriting. Seller-provided schedules are viewed as a starting point, not a conclusion. (Pioneer Capital Advisory) The underwriter should interrogate each add-back: Is it truly non-recurring? Would it reappear under new ownership? Can it be traced to source documents?
- Adjust for Run-Rate Costs the Business Must Add: If a founder-owner’s $400K salary is being added back and replaced with a $200K market-rate CEO, the net adjustment is $200K, not $400K. Similarly, if the business has deferred maintenance capex, or lacks a CFO, those costs belong in the normalized earnings base.
- Stress and Triangulate: Cross-check normalized EBITDA against revenue-to-margin ratios for comparable companies, historical performance in a downturn, and customer concentration risk. A business with 40% revenue from one customer requires a scenario run with that customer removed.
Applied Example: A $10M EBITDA Manufacturing Company
Reported EBITDA (TTM): $8,200,000
Sponsor’s Add-Backs:
- One-time legal settlement: +$400,000
- Excess owner compensation (above $250K market rate): +$550,000
- Restructuring / plant closure costs: +$600,000
- “COVID-related” revenue shortfall adjustment: +$250,000
Sponsor’s Adjusted EBITDA: $10,000,000
Lender’s Challenges:
- Legal settlement: Accept (documented, non-recurring): +$400,000 ✓
- Owner comp: Accept net of replacement CFO cost ($550K add-back less $150K CFO gap): +$400,000 ✓
- Plant closure: Reject, plant closures have occurred twice in five years; treat as semi-recurring: $0 ✗
- COVID revenue shortfall: Reject, revenue has not recovered to pre-COVID levels; forward-looking adjustment is speculative: $0 ✗
Lender’s Normalized EBITDA: $9,000,000
The $1M gap between sponsor and lender EBITDA, at a 5.5x leverage multiple, implies $5.5M less debt capacity and a fundamentally different loan sizing conversation.
The Analysis: From Earnings to Debt Capacity
Once the lender has constructed its own normalized EBITDA, the underwriting analysis flows through three interlocking calculations that govern deal structure:
1. Leverage Ratio (Debt / EBITDA)
Lenders underwrite acquisition financing based on Debt/EBITDA ratios and fixed charge coverage ratios. An inflated normalized EBITDA that lenders do not accept in their own underwriting does not support the debt capacity needed to achieve target returns. (Ferdinand Partners) Using the example above: at a $45M purchase price with $36M of debt, the leverage ratio against sponsor EBITDA is 3.6x, but against lender EBITDA of $9M, it rises to 4.0x. Upper mid-market buyouts typically secure financing at 5.0x to 5.5x EBITDA, while lower mid-market transactions generally range between 3.5x to 4.5x EBITDA. (PGIM, via Private Capital Global) At 4.0x on the lender’s own EBITDA, this deal clears, but barely, and with limited headroom.
2. Fixed Charge Coverage Ratio (FCCR)
FCCR = (EBITDA – Capex – Taxes – Unfunded CapEx) ÷ (Cash Interest + Scheduled Amortization). Lenders typically require FCCR of 1.15x to 1.25x at minimum, tested quarterly. A normalized EBITDA that shrinks by 10% (say, from one customer reducing orders) can push FCCR below the 1.0x floor and trigger a covenant breach. If EBITDA normalization is overly aggressive, DSCR may appear acceptable on paper but fail during underwriting. (Pioneer Capital Advisory)
3. Stress Scenario Analysis
Institutional underwriters build at least two downside scenarios: a base case (15–20% EBITDA compression) and a stress case (30–35% compression). In the manufacturing example, a 25% EBITDA decline from $9M brings run-rate earnings to $6.75M. At $36M of debt, the stressed leverage ratio climbs to 5.3x, well into distress territory. The lender must determine: does the collateral base and recovery rate support that exposure?
Deals underwritten within the 2021 vintage have seen weaker performance, likely due to the impact from post-COVID-19 elevated earnings in specific sectors as well as liquidity pressures due to elevated leverage levels and rates. (Northleaf Capital, Q3 2025) This is the precise risk created by accepting add-backs based on elevated, non-repeatable post-COVID earnings.
Industry Standards, Red Flags, and Credit Performance Data
What Institutional Lenders Look For
During underwriting, lenders scrutinize discretionary expenses, ensure executive compensation aligns with market standards, and verify that related-party transactions, such as below-market rent, are adjusted to reflect actual economic reality. (ClearlyAcquired) Beyond the income statement, experienced credit teams examine permitted baskets in loan documentation. These baskets can materially change the risks to the lender: they can amplify the financial burden or impair the borrower’s ability to repay the loan through the release of cash to other parties. (bfinance)
The most important contributor to increasing risk is how cash flows are actually being estimated through adjusted EBITDA. (bfinance) Covenant headroom is only as protective as the EBITDA base against which it is measured. A maintenance covenant set at 5.5x leverage provides no real protection if the normalized EBITDA used to define that threshold was inflated.
Five Red Flags Underwriters Must Escalate
- “One-time” items that recur annually: If restructuring, litigation, or integration costs appear in three of the last five years, they are not one-time; they are a cost of doing business in that company.
- Stock-based compensation (SBC) add-backs: Many PE buyers exclude SBC specifically when calculating debt capacity, because lenders underwriting leverage ratios should not extend credit against earnings that are inflated by adding back genuine compensation costs. (Ferdinand Partners)
- Forward-looking or “run-rate” revenue synergies: Adjustments for revenue that hasn’t been earned yet (from new contracts, new hires, or price increases) have no place in trailing EBITDA underwriting.
- Expanding add-back schedules in competitive processes: Sellers who treat adjusted EBITDA as a marketing exercise rather than an underwriting exercise consistently lose credibility and leverage during diligence. (Windsor Drake) An add-back schedule that grows with each auction round is a process integrity signal.
- PIK interest masking cash flow stress: PIK loans in private credit allow borrowers to defer cash interest payments by adding them to the loan’s principal instead. This provides companies with liquidity but increases their total debt, which can raise long-term credit risk. (Financial Stability Board, May 2026)
📊 Data Box: Credit Performance Benchmarks (2024–2025)
- Leveraged Loan Default Rate (Morningstar LSTA): 1.5% trailing-12-month as of Q3 2025; rising to 4.3% when including distressed Liability Management Exercises (LMEs). (Northleaf Capital / LSTA, Q3 2025)
- S&P Global Leveraged Loan Default Forecast: 1.6% through December 2025, with a pessimistic scenario of 2.5% driven by tariff and macro headwinds. (S&P Global Ratings, March 2025)
- Middle Market Direct Lending Default Rate (KBRA, 2024): 1.1% by count (0.7% by debt); with 5% of portfolio flagged as struggling. Companies with $25M–$50M EBITDA showed the highest default cohort at 3.6%. (KBRA Analytics, Q4 2024)
- Cliffwater Direct Lending Index (CDLI), 20-Year Loss Rate: 1.01% annual average loss rate across ~21,000 middle-market loans totaling $549 billion in assets, covering the period through 2024 including the Global Financial Crisis. (Cliffwater, 2026)
- First-Lien Recovery Rates: Long-run historical average of 75–80% on ultimate recovery basis; Moody’s current estimate of approximately 68%, reflecting loan-heavy capital structures with less junior debt to absorb losses. (Moody’s Ultimate Recovery Database, via CLO Research, 2024–2026)
The Bond Capital EBITDA Normalization Underwriting Checklist
Use this framework at the initial credit screening stage and at full underwriting committee presentation:
Phase 1: Documentation Assembly
- ☐ Three years of audited financial statements plus TTM management accounts (monthly detail)
- ☐ Detailed add-back schedule from sponsor/borrower, with line-item support for each adjustment
- ☐ Third-party Quality of Earnings (QoE) report, over 70% of M&A transactions now require formal financial due diligence QoE. (OGSCapital, 2025) Confirm the QoE firm was engaged by the buyer, not the seller
- ☐ Customer revenue concentration analysis (top 5 and top 10 customers as % of revenue)
- ☐ Related-party transaction register with market-rate comparisons
Phase 2: Independent EBITDA Reconstruction
- ☐ Rebuild EBITDA from P&L line items independently; do not start from sponsor’s adjusted number
- ☐ Test each add-back against a three-part standard: (1) Is it traceable to source records? (2) Is the rationale clear and non-recurring? (3) Would the cost truly disappear under new ownership?
- ☐ Recast executive and owner compensation to market-rate replacement costs
- ☐ Identify any items classified as COGS or SG&A that belong in capex (or vice versa)
- ☐ Adjust for any revenue recognized under aggressive accounting policies (percentage-of-completion, bill-and-hold, channel stuffing)
Phase 3: Metrics Calculation and Stress Testing
- ☐ Calculate Debt/EBITDA, FCCR, and Interest Coverage using lender’s normalized EBITDA (not sponsor’s)
- ☐ Run base case (–15% EBITDA), downside case (–25%), and stress case (–35%), verify FCCR stays above 1.0x in downside and above 0.85x in stress
- ☐ Model covenant headroom at each scenario; confirm at least 20% cushion in base case
- ☐ Perform customer concentration stress: model performance with top-1 customer at 50% revenue reduction
Key Questions to Ask Management
- ☐ “Can you walk me through every cost that was excluded from your adjusted EBITDA in the last three years, and explain why each will not recur?”
- ☐ “What is your normalized maintenance capex, and how does it differ from what you’ve actually spent?”
- ☐ “Which customer contracts are up for renewal within the next 24 months?”
- ☐ “What would the P&L look like if your top two customers each reduced volume by 20%?”
Key Takeaways for Credit Underwriters
- 🔵 The lender’s normalized EBITDA is not the sponsor’s adjusted EBITDA. Build it independently from source documents. Every add-back must clear three tests: traceability, non-recurrence, and economic reality post-close.
- 🔵 EBITDA inflation compounds through the entire credit structure. An overstated earnings base inflates debt capacity, compresses apparent leverage, loosens covenant headroom, and understates recovery risk, all simultaneously.
- 🔵 The 2021 vintage is the cautionary tale. Deals underwritten to post-COVID peak earnings with aggressive run-rate adjustments are now the highest-stress cohort in direct lending portfolios. Historical add-back accuracy must be cross-checked against actual performance.
- 🔵 Recovery assumptions must be calibrated to current market structure. With Moody’s estimating first-lien recoveries near 68%, below historical averages, lenders in loan-only capital structures carry more downside exposure than historical data implies. Stress scenarios should use 55–65% recovery in conservative cases.
- 🔵 Covenant headroom is only as good as the EBITDA definition underneath it. The absence or presence of covenants does not alone determine the strength of lender protections: factors such as covenant headroom, structural seniority, and overall credit quality are equally important. (StepStone Group / Golub Capital, 2H 2025) A covenant set against an inflated EBITDA base provides no real early-warning protection.


