
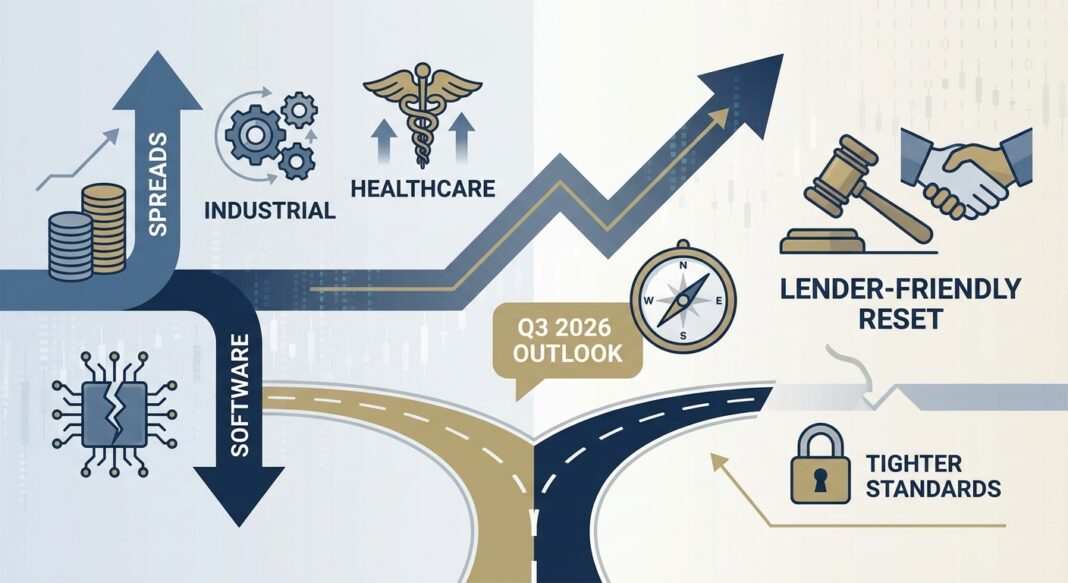
MARKET HEADLINE: The Lender-Friendly Reset Is Real, And It Has Teeth
The first half of 2026 has delivered a credit market reckoning that few modeled in their base cases. Three converging forces (the outbreak of the U.S.-Iran military conflict in late February, an accelerating artificial-intelligence–driven reassessment of software sector credit quality, and a wave of BDC and private credit redemption requests exposing structural vulnerabilities in the retail-oriented private credit model) have collectively pushed credit markets into a new phase of price discovery. Capstone Partners’ Q1 2026 leveraged finance analysis describes these as three converging and largely unforeseeable shocks that stalled M&A pipelines and materially repriced risk across the leveraged lending complex.
The net result is a lender-friendly reset that is redistributing negotiating leverage from borrowers back to capital providers for the first time since 2022. Lord Abbett’s 2026 Midyear Outlook confirms that spreads have widened roughly 50–100 basis points higher since late 2025, while covenant and documentation terms have simultaneously improved. Critically, this is not a systemic crisis; it is a structural bifurcation. Capital remains available, but lenders are being materially more selective, demanding better pricing, tighter covenants, and credible free cash flow profiles. The second half of 2026 will almost certainly be defined by dispersion: between sectors, between vintage years, and between managers who prepared for this moment and those who did not.
For institutional investors and operators navigating capital markets today, the imperative is precise intelligence on where spreads are pricing, which sectors are open for business, and what financial KPIs lenders are requiring at the underwriting table. The data below delivers exactly that.
QUANTITATIVE MARKET SNAPSHOT
Key Market Metrics: As of July 25, 2026
| Metric | Current Level | 3–6 Months Prior | Direction | Source |
|---|---|---|---|---|
| Overnight SOFR (base rate) | 3.64% | ~4.25–4.75% (late 2025 peak) | ↓ Declining, higher-for-longer outlook | NY Fed / SOFR Rate |
| 3-Month Term SOFR | 3.68% | 3.68% (Q1 2026) | → Flat QoQ; forward curve broadly flat | Valuation Research Corp. Q2 2026 |
| Middle Market Private Credit Spread (SOFR+) | ~S+500 bps | ~S+450–475 bps (mid-2025) | ↑ +50–100 bps since late 2025 | Hamilton Lane 2026 Private Credit Focus |
| B-Rated Secondary Loan Spreads vs. Year-End | +67 bps wider | Year-end 2025 baseline | ↑ Widening, led by tech/software | Valuation Research Corp. Q1 2026 |
| B-Minus Loan Spreads (lower credit tier) | S+409 bps | ~S+354 bps (Q4 2025) | ↑ +55 bps, bifurcation at low end | Sikich Q2 2026 Credit Market Update |
| Software Sector Secondary Spreads vs. B-Rated Index | ~+229 bps above B-rated index | ~In-line at year-end 2025 | ↑↑ Sharply wider; structural repricing | Valuation Research Corp. / PitchBook LCD |
| 5-Year U.S. Treasury Yield | 4.23% | 3.92% (March 2026) | ↑ +31 bps QoQ; adding to all-in cost of capital | Valuation Research Corp. Q2 2026 |
| Fed SLOOS: Net % Banks Tightening C&I Standards (Large/MM Firms) | +8.1% net tightening | Consistent tightening since Q4 2025 | ↑ Continued tightening; multi-quarter trend | Federal Reserve SLOOS / FRED, Q2 2026 |
| Private Credit Dry Powder | ~$264 billion | ~$275 billion (Q4 2025 est.) | ↓ Deployment active; selective in H1 2026 | Valuation Research Corp. Q2 2026 |
| Private Credit H1 2026 Fundraising | $262 billion | $~200 billion (H1 2025 est.) | ↑ +30% YoY; Q2 dominated at $173B | The Credit Crunch / H1 2026 Fundraising Report |
| Non-Traded BDC Redemption Requests (Q2 2026) | ~9.8–10% of NAV | 12.1% (Q1 2026 avg., peak) | ↓ Slight improvement but still ~2x the 5% cap | White Securities Law / Industry Trade Press |
| Estimated Private Credit Direct Lending Default Rate (2025) | ~1.6%–4.7% | ~1.5–2.0% (2023) | ↑ Rising; range reflects opacity and soft credit events | Moody’s: US Corporate Default Risk in 2026 |
Note: All-in private credit yield on a standard middle-market deal approximates SOFR (3.68%) + spread (~500 bps) = ~8.68% gross yield, before fees and OID, as of mid-July 2026. Data reflects most recently available public reporting.
SECTOR ANALYSIS: Healthcare Ascends as Software Retreats
The most consequential structural shift in leveraged credit markets in the first half of 2026 is the displacement of software as the dominant sector for direct lending and institutional loan issuance, a position it had held for over a decade. PitchBook LCD data confirms that healthcare has claimed the top spot in institutional loan issuance for the first time since 2015, accounting for approximately 14% of volume year-to-date through mid-2026. Simultaneously, software’s share of broadly syndicated loan issuance has collapsed to roughly 9%, approximately half its 2025 level and the lowest since 2013. In the PE-backed universe, that drop is even more striking: from a 24% peak in 2020 to just 9% today.
This is not simply a cyclical rotation. Sikich’s Q2 2026 Credit Market Update argues that AI-driven disruption of legacy software business models increasingly looks like a structural credit story rather than a cyclical one, requiring lenders to underwrite technology risk with sharper scrutiny. The data supports this view: software secondary spreads are approximately 245 bps wider than year-end levels and roughly 229 bps above the broader B-rated loan index, per Valuation Research Corp. / PitchBook LCD. Meanwhile, Morningstar / PitchBook LCD data finds that more than half of private credit lenders surveyed are actively reducing their allocation to the software sector.
Healthcare: Lender appetite for healthcare is at its strongest in a decade. PitchBook’s Q2 U.S. Private Credit Wrap shows healthcare surpassing technology as the sector capturing the largest share of new direct lending deals by count since the year began. Pricing reflects the preference: a Q2 2026 healthcare financing for Caris Life Sciences priced at S+500, meaningfully tighter than stressed software-sector deals. According to PitchBook’s US Private Credit Monitor, healthcare deals made up 22% of direct lending issuance year-to-date through March, up from 18% in 2025. The sector’s structural appeal is clear: recurring revenue, non-cyclical demand, stable patient volumes, and strong sponsor interest in platform acquisitions.
Energy & Industrials: PitchBook LCD’s sector analysis identifies energy and aerospace/defense as running meaningfully above their historical loan issuance norms, with seven of the top ten lending sectors by volume growing their share relative to both 2025 and their ten-year averages. However, energy is a double-edged story: lenders are tightening underwriting standards for energy-intensive industries whose leverage was predicated on stable energy costs, per Capstone Partners.
Software & Technology: Morningstar LSTA data shows a record $25 billion of software-sector loans now trading below the distress threshold of 80 cents on the dollar. Capstone Partners notes that an AI strategy and evaluation of AI risk on a business have emerged as a critical analytical component in underwriting new transactions, a seismic shift from just two years ago when software commanded premium valuations and the tightest spreads in leveraged credit.
Credit Secondaries: One structural beneficiary of the volatility is the credit secondaries market. Ropes & Gray reports that private credit secondaries achieved near-threefold volume growth in 2025, and Credit Crunch’s H1 2026 analysis confirms credit secondaries set all-time highs in the first half, with Ares leading via a $7 billion raise.
IMPLICATIONS: What This Means for Borrowers and Investors
For Borrowers & Operators
Higher All-In Cost of Capital Is Now Structural, Not Cyclical. With overnight SOFR at 3.64%, 3-month Term SOFR at 3.68%, and middle-market private credit spreads resetting to approximately S+500, all-in borrowing costs for a standard middle-market deal now approximate 8.5–9.0% before fees and OID. The Valuation Research Q2 2026 report confirms that market expectations reflect a higher-for-longer rate environment, with the forward curve broadly flat as of June 2026. Operators should model debt service at current levels without anticipating meaningful near-term base rate relief.
Underwriting Standards Are Tightening on Multiple Dimensions. The April 2026 Fed SLOOS reported that a net 8.1% of domestic banks tightened C&I lending standards for large and middle-market firms in Q2 2026, a consistent multi-quarter pattern. Banks are simultaneously tightening all surveyed terms on loans to non-depository financial institution (NDFI) counterparties, including private equity funds. This is compressing the availability of bank-sourced leverage for the private credit ecosystem itself. Operationally, borrowers should expect lenders to scrutinize fixed charge coverage ratios (FCCRs) more aggressively, particularly for businesses with FCCR coverage below 1.25x at current all-in rates. Lord Abbett explicitly flags that the most durable advantage for lenders comes from more conservative leverage, better documentation, and stress-tested free cash flow analysis before capital is deployed.
AI Exposure Is Now an Underwriting Variable. The January 2026 SLOOS included a special question on AI exposure, with banks reporting being more likely to approve loans to firms benefiting from AI and less likely to approve loans to firms disrupted by it. Borrowers in software, SaaS, and legacy technology services must now provide an explicit AI risk assessment and competitive response strategy to access institutional capital at reasonable terms.
For Institutional Investors & Lenders
Dispersion Is the Defining Theme of H2 2026. Lord Abbett’s mid-year view is direct: the gap between stronger and weaker portfolios will become more visible. Non-accruals, PIK usage, sector concentration, and 2021–2022 vintage exposure are the key diagnostic metrics. Moody’s estimates the approximate private credit direct lending default rate in 2025 was in the 1.6%–4.7% range, a wide range that itself reflects the opacity of the market and the role of distressed exchanges in masking underlying stress. Investors must demand granular portfolio transparency, not headline NAV figures.
BDC Redemption Stress Signals a Structural Maturity Mismatch. Redemption requests from the 12 largest non-traded BDCs averaged 12.1% in Q1 2026, well above the 5% gating threshold, and remained elevated at approximately 9.8–10% of NAV in Q2. The industry trade press reports some investors received approximately 62 cents on the dollar of requested redemptions. The Fed’s May 2026 Financial Stability Report acknowledged that outflows from private credit funds moderately exceeded new inflows in Q1 2026 for the first time in the cycle, per CT Acquisitions’ BDC Performance Report. Critically, the Fed also concluded that stability risks appear "limited and manageable" at the systemic level.
Fundraising Concentration Amplifies Manager Selection Risk. In 2024, the top 10 private credit managers captured 94.7% of all capital raised, up from 81.5% in 2023. While overall H1 2026 fundraising rose 30% year-over-year to $262 billion per Credit Crunch’s H1 analysis, fewer funds are raising and the largest managers are capturing a disproportionate share. For LPs, this means manager selection has never been a more consequential decision.
FORWARD-LOOKING VIEW: Next 3–6 Months
The credit market landscape for H2 2026 will be shaped by four key variables. First, the trajectory of the U.S.-Iran conflict and its effect on energy costs and inflation expectations, which directly feed into the Fed’s rate path and borrower operating cost structures. Second, the pace of software sector credit deterioration: with $25 billion in software loans already trading below 80 cents on the dollar, the critical question is whether this represents a contained pool of legacy LBOs or the leading edge of a broader AI disruption cycle. Third, the BDC maturity wall: a $12.7 billion BDC maturity wall in 2026, a 73% increase over 2025, per Moody’s arrives precisely as portfolio quality is deteriorating, creating a potential refinancing overhang. Fourth, whether M&A deal flow materializes sufficiently to absorb the $1.13 trillion in U.S. PE dry powder and $264 billion in private credit dry powder waiting for deployment.
Valuation Research Corp. confirms that direct lending market conditions stabilized during Q2 following March volatility, and that lending activity remains competitive for higher-quality deals, a bifurcated dynamic that is likely to persist. Sikich’s Q2 2026 analysis frames the defining question for H2 precisely: not whether the cycle turns, but which side of the market’s growing bifurcation each borrower, sponsor, and lender occupies when it does.
KEY MARKET INSIGHTS: 5 Actionable Takeaways
- Spreads have reset, and the reset is structural: Middle-market private credit spreads are now approximately S+500, up 50–100 bps from mid-2025 lows. Combined with Term SOFR at 3.68% and 5-year Treasuries at 4.23%, all-in borrowing costs for middle-market operators are running 8.5–9.0%+. Model debt service at these levels; do not underwrite to a base rate cut that the forward curve is not pricing.
- Healthcare is the new software: Healthcare has reclaimed its position as the largest sector for institutional loan issuance (14% share) for the first time since 2015, while software has collapsed to its lowest share since 2013 (9%). Operators in healthcare with defensible recurring revenue, EBITDA margin above 20%, and FCCR above 1.25x are finding the most competitive credit markets in years. Software borrowers without an explicit AI risk narrative will face materially higher spreads and tighter covenants.
- Bank tightening is not cyclical; it is structural: The Fed SLOOS confirms net 8.1% tightening in C&I standards for large and middle-market firms in Q2 2026, with additional tightening on all NDFI loan terms. Banks are constraining leverage to private credit funds themselves, which will slow deployment velocity and increase selectivity among direct lenders. Borrowers seeking bank alternatives should expect similar discipline from private lenders in the upper middle market.
- BDC performance divergence demands granular diligence: With non-traded BDC redemption requests running at approximately 2x the standard 5% cap, and non-accrual rates approaching elevated territory at several platforms, LPs must demand transparency on software concentration, PIK income as a percentage of total income, vintage year exposure (2021–2022 is the highest-risk cohort), and manager-level leverage ratios. Conservative BDC leverage benchmarks range from 0.8–1.1x net debt-to-equity; anything above 1.2x warrants close scrutiny.
- Credit secondaries and direct lending in non-software sectors offer the clearest opportunity: With $262 billion raised in H1 2026 and credit secondaries setting all-time records, the market is signaling where sophisticated capital is moving. Managers with dry powder, disciplined underwriting, and healthcare/industrial/infrastructure sector focus are best positioned to capitalize on what Lord Abbett characterizes as a genuine opportunity, one where the advantage goes to those who combine patience with discipline.


