
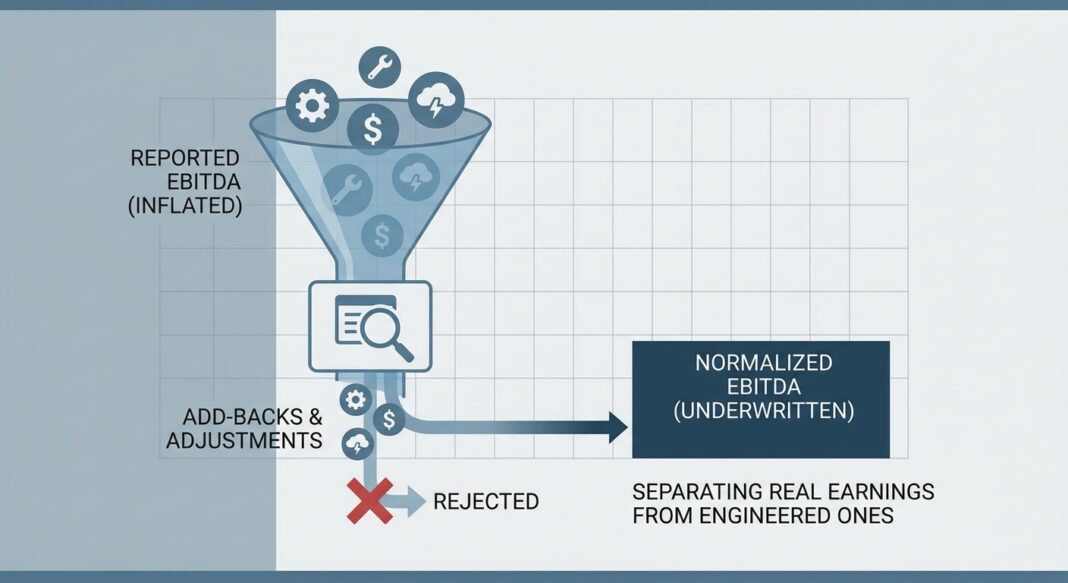
The Underwriting Question That Changes Everything
A sponsor-backed manufacturing company presents its credit package with $12.4 million in reported EBITDA, and $15.2 million in “Adjusted EBITDA” after a schedule of 11 add-backs. The gap is $2.8 million, or roughly 23% of the reported figure. Your leverage multiple on reported EBITDA is 5.1x. On adjusted EBITDA, it compresses to 4.2x. Which number do you underwrite?
This is not a hypothetical. It is the daily reality of credit underwriting in the middle market. Every dollar of inflated or unjustified adjusted EBITDA has a disproportionate impact on valuation and debt capacity. The stakes are structural: lenders underwrite acquisition financing based on Debt/EBITDA ratios and fixed charge coverage ratios, so an inflated EBITDA base directly enables excess leverage, leverage that must be serviced from actual cash flows that may never match the pro forma.
Getting EBITDA normalization right is not a secondary diligence task. It is the primary underwriting act. The number you accept at close becomes the denominator of every covenant test, the foundation of your stress scenario, and the basis of your recovery thesis if the credit deteriorates.
This article provides a practitioner’s framework for stress-testing EBITDA add-backs, identifying manipulation patterns, and establishing a defensible, lender-underwritten earnings figure for middle market credit decisions.
The Analytical Framework: Three Layers of EBITDA Scrutiny
Experienced credit underwriters approach EBITDA normalization in three sequential layers: (1) Mechanical Reconciliation, (2) Economic Validity Testing, and (3) Sustainable Cash Flow Conversion. Each layer filters out a different category of earnings inflation.
Layer 1, Mechanical Reconciliation: Build the Bridge
Start with audited or reviewed net income and build upward. The general objective is to add back interest, taxes, depreciation, and amortization, as well as certain other non-cash, extraordinary, and transaction-related items deducted from earnings when determining net income. Map every line item in the seller’s add-back schedule to its source document: trial balance, GL detail, or third-party invoice. Any item without a traceable source is, by default, rejected.
The critical distinction at this stage is between Adjusted EBITDA and Normalized EBITDA. Adjusted EBITDA is the bridge from reported financials to a cleaned-up earnings number after removing one-time and non-operating items. Normalized EBITDA goes further to reflect the earnings a buyer can sustainably underwrite after considering steady-state staffing, market compensation, and necessary reinvestment. Normalized EBITDA can actually be lower than Adjusted EBITDA when a business requires cost additions under new ownership, a distinction that aggressive sellers routinely obscure.
Layer 2, Economic Validity Testing: Challenge Every Add-Back
Each proposed adjustment must pass a three-part test:
- Truly Non-Recurring? One-time legal settlements, restructuring charges, and transaction costs generally qualify. Growth investments, recurring maintenance capex disguised as one-time spend, and gradually increasing “non-recurring” costs do not.
- Economically Neutral to New Owner? During underwriting, lenders scrutinize discretionary expenses, ensure executive compensation aligns with market standards, and verify that related-party transactions, such as below-market rent, are adjusted to reflect actual economic reality. A seller paying $180K in owner salary when market replacement is $380K creates a negative normalization, not a positive one.
- Documented and Traceable? The standard is traceability and reasonableness: can the adjustment be traced to records, is the rationale clear, and would the cost truly disappear or change under new ownership?
Layer 3, Cash Flow Conversion: EBITDA to Free Cash Flow
EBITDA is not cash. The conversion requires subtracting cash taxes, cash interest, maintenance capex, and normalized working capital investment. A private equity buyer’s investment committee and lenders usually focus on a more conservative underwritten figure precisely because debt repayment, a core source of return in leveraged structures, is funded by free cash flow, not EBITDA. A business with $10M EBITDA but $3M in maintenance capex, $2M in cash interest, and $1M in normalized working capital build delivers only $4M in free cash flow, a 40% conversion rate that changes the entire leverage calculus.
Walking Through the Numbers: A $10M EBITDA Manufacturing Example
Consider a Midwest precision parts manufacturer presenting the following adjusted EBITDA schedule to support a $55M credit facility request (5.5x leverage on adjusted EBITDA):
| Line Item | Seller Claim | Underwriter Verdict | Rationale |
|---|---|---|---|
| Reported Net Income | $4,200,000 | $4,200,000 | Audited; accepted |
| + D&A | $2,100,000 | $2,100,000 | Standard; accepted |
| + Interest Expense | $980,000 | $980,000 | Standard; accepted |
| + Income Taxes | $540,000 | $540,000 | Standard; accepted |
| + One-Time Legal Settlement | $320,000 | $320,000 | Documented; accepted |
| + Owner “Excess” Compensation | $680,000 | $280,000 | Partial: Market CEO replacement = $400K; add-back net of market rate only |
| + “Non-Recurring” IT Upgrades | $450,000 | $0 | Rejected: Third year in a row; maintenance capex pattern |
| + Run-Rate Cost Savings (Projected) | $730,000 | $0 | Rejected: Not yet realized; no implementation plan provided |
| Adjusted / Normalized EBITDA | $10,000,000 | $8,420,000 | $1.58M gap; leverage re-prices to 6.5x |
The underwriter’s normalized figure of $8.42M repositions the proposed credit from 5.5x to 6.5x leverage: a structurally different risk profile that may breach institutional hold limits or require enhanced covenant protection. A single rejected $100K add-back at a 6x multiple costs $600K in enterprise value; the inverse logic applies to lenders underwriting debt capacity against inflated earnings.
Stress Scenario: Revenue Compression Test
Apply a 15% revenue shock (common for a single-customer-concentrated manufacturer) to the underwriter’s $8.42M normalized EBITDA. Assume 60% variable cost structure and $3.2M fixed cost base. Stressed EBITDA falls to approximately $5.7M. At $55M debt, stressed leverage reaches 9.6x: a level that triggers breach of virtually any maintenance covenant and eliminates any meaningful debt service coverage. This stress test, performed before close, is the difference between informed underwriting and deferred loss recognition.
Industry Standards, Red Flags, and Credit Performance Data
What Institutional Lenders Require
Sellers who treat adjusted EBITDA as a marketing exercise rather than an underwriting exercise consistently lose credibility and leverage during diligence. Institutional lenders, particularly those operating under regulatory guidance, apply additional scrutiny. Especially for highly leveraged deals, regulated lenders have an interest in creating a thoughtful definition of EBITDA that avoids unnecessarily painting an overly leveraged picture of the lender’s loan portfolio.
The rise of covenant-lite structures has compounded the risk of accepting inflated EBITDA at close. Cov-lite loans essentially eliminate financial covenant requirements with only a debt incurrence test in place, sidelining lenders from acting until a “capital D” default occurs, which is often triggered by a payment default. When the only enforcement trigger is a missed payment, an inflated underwriting EBITDA has no self-correcting mechanism during deterioration.
PIK loans allow borrowers to defer cash interest payments by adding them to the loan’s principal instead, providing liquidity but increasing total debt and raising long-term credit risk. The use of certain PIK arrangements is positively correlated with borrower stress, and PIK-heavy credit packages frequently arrive with the most aggressive add-back schedules, as the borrower needs both the PIK toggle and the inflated EBITDA to make leverage ratios appear acceptable.
📊 Credit Performance Data Box
- Private Credit Default Rate (2025): Moody’s analysis suggests the private credit default rate in 2025 likely ranged between 1.6% and 4.7%, depending on whether distressed exchanges are included. (Source: Moody’s, April 2026)
- Distressed Exchange Share: Distressed restructurings accounted for approximately 65% of all defaults in 2025, marking a record-level reliance on out-of-court workouts rather than payment. (Source: Moody’s)
- Fitch Record High: Fitch Ratings reported that the U.S. private credit default rate hit a record high of 6.0% in April 2026. (Source: Forbes / Fitch, May 2026)
- Recidivism Risk: More than 70% of eventual hard defaults following a distressed exchange occur within the first two years. Borrowers that restructured in 2023–2024 are currently in their highest-risk window. (Source: Moody’s Default & Recovery Database)
- Middle Market Borrower Stress: KBRA’s Q4/25 surveillance of 2,416 unique middle market sponsored borrowers found that 19% reported declining sales and 22% reported declining EBITDA, with multilevel downgrades surging 2.9 times quarter over quarter. (Source: KBRA via ABF Journal)
- First-Lien Recovery Drift: Moody’s has estimated expected ultimate recoveries on U.S. first-lien loans at roughly 68%, versus long-run historical experience in the high 70s. (Source: Moody’s Ultimate Recovery Database, collateralizedloanobligations.com)
- Sector Concentration: Roughly 30% of the distressed restructurings in 2024 were from three sectors: healthcare/pharmaceuticals, business services, and high-tech industries. (Source: Moody’s Leveraged Finance Interest, January 2025)
The Five Most Common Red Flags in EBITDA Add-Back Schedules
- Recurring “Non-Recurring” Costs: Any expense appearing in the add-back schedule in two or more consecutive years is almost certainly operational. IT upgrades, consulting fees, and “restructuring” charges that recur annually are maintenance costs, not anomalies.
- Unrealized Run-Rate Savings: Pro forma cost synergies and projected headcount reductions that have not yet been implemented belong in the equity upside case, not in the lender’s underwriting EBITDA. Buyers focus on which earnings will continue after closing, which costs must be replaced, and which assumptions belong in upside rather than purchase price.
- Owner Compensation Below Market: The add-back should be the differential between actual owner compensation and market replacement cost, not the entire owner salary. Sellers frequently claim full salary as an add-back while ignoring that a replacement CEO requires a competitive package.
- Related-Party Transactions at Non-Market Rates: Below-market rent from an owner-controlled entity, intercompany management fees, and family-member payroll are common distortions in lower middle market credits. Each requires restatement to market economics.
- Stock-Based Compensation (SBC) Add-Backs: Many PE buyers exclude SBC specifically when calculating debt capacity, because lenders underwriting leverage ratios should not extend credit against earnings inflated by adding back genuine compensation costs.
Underwriting Checklist: EBITDA Normalization Diligence Protocol
Documentation Requirements
- ✅ Three years of audited or CPA-reviewed financial statements (five years preferred for cyclical industries)
- ✅ Monthly or quarterly trial balance detail for the LTM period
- ✅ Seller’s complete add-back schedule with GL account references for every line item
- ✅ Third-party Quality of Earnings (QoE) report from a recognized accounting firm
- ✅ Customer revenue disaggregation (top 10 customers by revenue; contract terms and renewal status)
- ✅ Management compensation benchmarking (comparable public company or industry survey data)
- ✅ Related-party transaction schedule with market comparables
- ✅ Capex schedule, split between maintenance and growth for each of the last three years
- ✅ Working capital analysis: 13-week cash flow and seasonal high/low NWC profile
Questions Every Underwriter Must Ask
- ❓ Has this “non-recurring” item appeared in prior years? Pull GL detail for T-3 years.
- ❓ What is the market rate for executive replacement, and is the add-back net of that cost?
- ❓ Are run-rate savings already implemented, and can headcount reduction be verified by current org chart?
- ❓ What percentage of revenue is concentrated in the top three customers, and do contracts include price escalation or renewal risk?
- ❓ What is the maintenance capex required to sustain current revenue: verified by fleet age, equipment replacement schedules, or facility condition reports?
- ❓ Does the business have any PIK-toggled debt at the portfolio company level, and has interest been properly excluded from EBITDA-to-cash-flow conversion?
- ❓ Has the lender’s own credit team independently stress-tested EBITDA at −10%, −20%, and −30% revenue scenarios?
Key Takeaways for Credit Underwriters
- Seller EBITDA is a starting point, not a conclusion. Lenders independently evaluate normalized EBITDA during underwriting; seller-provided schedules are viewed as a starting point, not a conclusion. Every item must be independently verified against source documents before inclusion in the underwriting model.
- The gap between reported and adjusted EBITDA is now a primary risk signal. The bridge between reported and adjusted EBITDA is no longer just a meme-worthy punchline; it is a red flag in the eyes of investors and diligence teams that needs to be proactively addressed. A large, poorly documented add-back schedule is itself evidence of earnings quality risk.
- Distressed exchange activity signals latent EBITDA inflation at the portfolio level. With distressed restructurings comprising approximately 65% of all 2025 private credit defaults (Moody’s), many of these credits were underwritten to inflated EBITDA figures that could not withstand rate stress or revenue compression. Underwriters who accepted aggressive add-backs at close are managing those outcomes today.
- Free cash flow conversion is the ultimate EBITDA validity test. A normalized EBITDA figure that does not convert to serviceable free cash flow after maintenance capex, taxes, and interest is a warning sign, not a foundation for debt structuring. Build the cash conversion bridge before sizing any facility.
- Covenant design must anchor to lender-underwritten EBITDA, not seller-adjusted EBITDA. Financial maintenance covenants (leverage tests, coverage ratios, and liquidity floors) should be set against the conservative, lender-verified earnings figure. Covenants anchored to inflated EBITDA create false headroom and eliminate the early warning function that covenants are designed to provide.


