
The Underwriting Question That Drives Every Other Number
A sponsor presents a confidential information memorandum for a $10M EBITDA manufacturing company. The acquisition debt is sized at 5.0x, producing a $50M facility. Covenants are set accordingly. Pricing is approved. But embedded in that $10M figure are $2.1M in management-proposed add-backs: a one-time restructuring charge, projected synergies from a plant consolidation not yet underway, and above-market owner compensation that will require a replacement hire.
The credit committee’s real question isn’t whether the leverage ratio looks acceptable. It’s whether the EBITDA powering that ratio is real.
EBITDA adjustments and normalization sit at the absolute center of credit underwriting. Every leverage multiple, every interest coverage calculation, every covenant threshold, and every debt repayment projection is downstream of a single earnings figure that is frequently the product of negotiation as much as accounting. Understanding how to construct, stress, and defend that number (and how to identify when it has been stretched beyond recognition) is a core competency for any serious credit professional.
The Analytical Framework: From Reported EBITDA to Lender-Accepted Earnings
Normalized EBITDA is not simply a cleaner version of reported earnings. It is, as practitioners define it, a defensible estimate of sustainable operating earnings: the figure that survives Quality of Earnings (QoE) review, passes credit committee scrutiny, and can be credibly modeled over a five-to-seven year repayment horizon.
The construction process moves through four distinct stages:
- Start with reported EBITDA: Net income plus interest, taxes, depreciation, and amortization, as stated in audited financials.
- Normalize for non-recurring and owner-specific items: Remove one-time costs, personal expenses run through the business, and compensation above market-rate replacement cost.
- Apply only verifiable run-rate adjustments: Pro forma effects of acquisitions completed and fully integrated, demonstrable cost saves already realized, and annualization of recent hires.
- Arrive at lender-accepted adjusted EBITDA: The earnings base the credit committee will use for debt sizing, covenant calibration, and coverage analysis.
Example: A $10M EBITDA Manufacturing Company
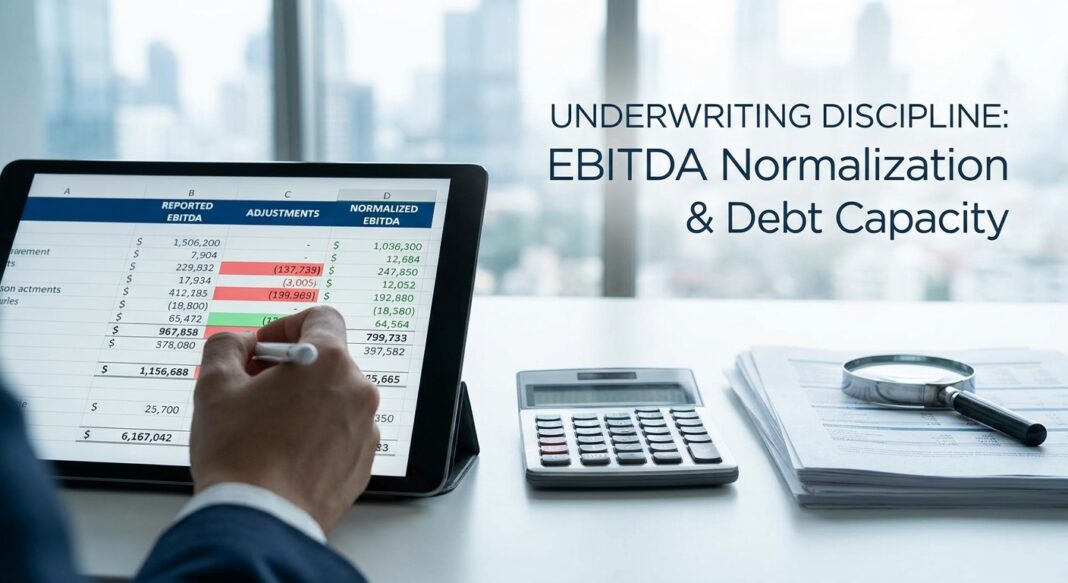
The borrower presents the following EBITDA bridge to their investment bank:
| Item | Amount | Lender Assessment |
|---|---|---|
| Reported LTM EBITDA | $7.90M | Audited baseline, accepted |
| + One-time litigation settlement | $0.60M | Accepted with documentation |
| + Above-market owner compensation | $0.80M | Accepted, $400K market-rate replacement cost verified |
| + Projected plant consolidation synergies | $0.70M | Challenged, project not initiated |
| Lender-Accepted Adjusted EBITDA | $9.30M | $700K synergy add-back haircut to zero |
The difference between the sponsor’s $10M and the lender’s $9.3M may seem modest, but at 5.0x leverage it represents a $3.5M reduction in permissible debt, and a materially different covenant cushion at close. auxocapitaladvisors.com
Walking the Analysis: What Lenders Actually Do with the Numbers
1. The LTM Bridge and Stub-Period Construction
Most private credit transactions are underwritten to Last Twelve Months (LTM) EBITDA, not to the most recent fiscal year. LTM is constructed as: Full-Year EBITDA + Current YTD EBITDA − Prior-Year YTD EBITDA. The stub-period adjustment is the most error-prone step: both stubs must match on duration to the day, use the same accounting basis, and apply identical treatment of depreciation, lease classification, and stock-based compensation. Any inconsistency in the bridge inflates or deflates the earnings base before a single add-back is even applied. ctacquisitions.com
2. Stress Testing Coverage Ratios
Once lender-accepted EBITDA is established, the underwriter models three scenarios against the proposed debt structure:
- Base Case: Flat EBITDA, no growth. Does interest coverage hold above 1.5x?
- Downside (−15% EBITDA): Common for cyclical industries. Does the company remain covenant compliant?
- Severe Stress (−25–30% EBITDA): Simulates a recession or demand shock. Is there a viable path to recovery, or does the enterprise value fall below outstanding debt?
The Federal Reserve’s interagency leveraged lending guidance is explicit: institutions should require projections to include “one or more realistic downside scenarios that reflect key risks identified in the transaction.” A leverage level in excess of 6.0x Total Debt/EBITDA raises supervisory concerns for most industries. federalreserve.gov
3. Free Cash Flow Conversion Check
EBITDA and free cash flow are not the same thing. An underwriter must reconcile: EBITDA less cash taxes, less cash interest, less maintenance capex, less changes in working capital. If EBITDA grows while operating cash flow stagnates, the gap warrants investigation; it may signal aggressive revenue recognition, deteriorating working capital, or one-time items cycling through the income statement. msllc.com
What Institutional Lenders Look For, and What They Reject
The Add-Back Discipline Problem
EBITDA add-backs are not a peripheral issue; they are a systemic risk in private credit underwriting. Research in the leveraged loan market has shown that most projected synergy and cost-save adjustments fail to materialize at the levels claimed. Lenders have responded by imposing caps: a credit agreement should cap each individual add-back at a dollar amount or percentage of EBITDA, and total add-backs are commonly capped, practitioners cite limits such as total adjustments not exceeding 25% of EBITDA. flatrockglobal.com
Run-rate cost savings and synergy add-backs are among the most closely scrutinized. Unlike standard add-backs that reverse an expense already incurred, synergy adjustments increase EBITDA today for benefits that have not yet materialized in the company’s financial statements, making them inherently speculative. davispolk.com
Covenant Design Follows Earnings Definition
The power of every financial maintenance covenant hinges directly on the EBITDA definition in the credit agreement. Private credit lenders have maintained firmer positions on covenant inclusion than syndicated markets: maintenance covenants, tested quarterly on leverage or fixed charge coverage, have returned to many PE-backed middle-market deals. In contrast, approximately 90% of broadly syndicated loans in 2024 remained covenant-lite. privatecapitalglobal.com
For growth-oriented or software businesses where EBITDA may not reflect enterprise value, lenders have evolved toward alternative metrics, such as Annual Recurring Revenue (ARR) covenants that test revenue durability and liquidity runway rather than near-term profitability. Lenders in 2026 are increasingly shifting from ARR-based to EBITDA-based frameworks for software, demanding wider spreads to compensate for AI disruption uncertainty. partnersgroup.com
📊 Data Box: Credit Performance Benchmarks (2025–2026)
- Cliffwater CDLI 20-Year Average Annual Loss Rate (2004–2024): 1.01% across approximately 21,000 loans totaling $549 billion in assets, a loss-rate methodology that counts recovery, not just default count. angelinvestorsnetwork.com
- Fitch Private Credit Default Rate (2025, published March 2026): 9.2%, reflecting a broader, count-based methodology inclusive of restructurings and amendments. angelinvestorsnetwork.com
- Morningstar LSTA Leveraged Loan Index Payment Default Rate: 1.23% in 2025, up from 0.91% in 2024. angelinvestorsnetwork.com
- Private Credit Non-Accrual Rate (Q4 2025): Approximately 1.3% of cost, below the post-GFC average; the share of borrowers with sub-1.0x interest coverage declined to 14% in Q4 2025, from 21–23% throughout 2023 and early 2024. partnersgroup.com
- Average LBO Equity Contribution at Origination (2026): ~50%, up from ~35% in 2013, providing lenders with materially greater downside cushion at origination. partnersgroup.com
- Covenant-Lite Prevalence (Broadly Syndicated, 2024): ~90% of new loans, versus private credit middle-market deals, which have retained stronger maintenance covenant inclusion. privatecapitalglobal.com
Red Flags Every Underwriter Must Watch
- Add-backs exceeding 20–25% of reported EBITDA: signals that the deal economics may depend entirely on management projections rather than demonstrated earnings.
- PIK loan prevalence in the capital structure: PIK arrangements allow borrowers to defer cash interest by adding it to principal, providing liquidity but increasing total debt and long-term credit risk. Their use is positively correlated with borrower stress, particularly absent a strong private equity sponsor. fsb.org
- EBITDA growth without corresponding cash flow improvement: a divergence between accrual earnings and cash generation is among the earliest indicators of earnings quality deterioration.
- Synergy add-backs for initiatives not yet initiated: pro forma adjustments for unrealized events should be treated as speculative until supported by a credible implementation plan and timeline.
- Weak 2021-vintage deals: deals underwritten during the post-COVID elevated earnings environment have seen disproportionately weaker performance, driven by inflated LTM figures at origination and subsequent rate-driven coverage compression. northleafcapital.com
The Underwriting Checklist: EBITDA Normalization Due Diligence
Use the following framework at the credit analysis stage of every leveraged transaction:
✅ Step 1: Establish the Audited Baseline
- Obtain three years of audited financial statements plus the most recent interim period.
- Confirm the accounting basis (GAAP/IFRS) and revenue recognition policy has not changed across periods.
- Construct LTM EBITDA using the stub-period method; verify matching duration and consistent accounting treatment across stubs.
✅ Step 2: Interrogate Every Add-Back
- Require documentary support for each adjustment (invoices, board resolutions, third-party QoE reports).
- Categorize each add-back: historical and non-recurring (highest credibility), run-rate realized (acceptable with evidence), or forward-looking projected (subject to haircut or rejection).
- Apply an aggregate add-back cap, lenders commonly limit total adjustments to no more than 25% of EBITDA; flag any transaction where add-backs as a percentage of reported EBITDA exceed this threshold. flatrockglobal.com
- Require an independent Quality of Earnings report from a recognized accounting firm, particularly for transactions above $25M.
✅ Step 3: Validate the QoE Findings
- Confirm the QoE review covers: revenue recognition, customer concentration, gross margin trends, add-back support, working capital behavior, and cash conversion. auxocapitaladvisors.com
- Test whether adjusted EBITDA is consistent with operating cash flow over the same period, any persistent divergence demands explanation.
✅ Step 4: Build and Stress the Coverage Model
- Calculate Total Debt / Lender-Accepted EBITDA (target: <5.0x for most industries; supervisory concern threshold at >6.0x). federalreserve.gov
- Calculate EBITDA / Cash Interest Expense, minimum 1.5x for base case; ensure >1.0x under a 15% EBITDA decline scenario.
- Model full amortization of senior secured debt, or repayment of at least 50% of total debt, over a five-to-seven year horizon from base case cash flows. federalreserve.gov
✅ Step 5: Document and Covenant
- Write the EBITDA definition into the credit agreement with precision, cap each individual add-back and the aggregate total.
- Set maintenance covenants tested quarterly; align leverage step-downs to the projected de-levering path, not to sponsor preferences.
- Establish reporting requirements: financial statements within 45 days of quarter-end; compliance certificates concurrent with delivery; management’s written certification of add-back accuracy. sidley.com
Key Takeaways
- The EBITDA definition is the covenant. A poorly defined add-back regime can render even tightly structured leverage covenants meaningless, the definition of EBITDA can make or break every financial protection in the credit agreement.
- Synergy add-backs demand the highest standard of proof. Run-rate cost saves and projected synergies adjust EBITDA for events that have not yet occurred; without a credible, initiated implementation plan, these adjustments should be haircut to zero or capped conservatively at the underwriting stage.
- Free cash flow divergence is the earliest warning signal. When adjusted EBITDA grows but operating cash flow does not, the gap between reported earnings and economic reality is widening, and a credit event may follow.
- Maintenance covenants are a feature, not a concession. Private credit’s structural advantage over covenant-lite syndicated markets is its ability to monitor performance quarterly and intervene before a payment default, a lender who accepts covenant-lite documentation in the middle market is forfeiting that advantage.
- Underwriting discipline compounds over time. Data from the Cliffwater Direct Lending Index shows a 20-year average annual loss rate of 1.01% for the direct lending market, but dispersion around that average is wide. The difference between top-quartile and bottom-quartile credit performance traces directly to the rigor of EBITDA analysis and covenant construction at origination.


