
Underwriting & Risk Management, Bond Capital
EBITDA Normalization & Adjustment Discipline: The Lender’s Framework for Underwriting Defensible Cash Flow
Published: July 20, 2026
The Core Underwriting Question
A deal team receives a confidential information memorandum. The borrower, a $10M EBITDA industrial services company, presents a seller-adjusted EBITDA of $12.4M after applying $2.4M in claimed add-backs: $800K in one-time legal fees, $600K in excess owner compensation, $500K in COVID-era cost savings now “embedded,” and $500K in projected synergies from a bolt-on acquisition that hasn’t closed yet. The leverage multiple looks comfortable at 4.5x. The debt service coverage ratio (DSCR) clears the 1.25x threshold with room to spare.
Here is the underwriting question every credit officer must ask before writing a single term sheet: Which of those $2.4M in adjustments will the business still benefit from twelve months after closing?
The answer to that question, not the headline multiple, determines whether this loan is a performing credit or a future restructuring. Seller-provided EBITDA schedules are a starting point, not a conclusion. Lenders who accept management’s adjusted EBITDA at face value and reverse-engineer a credit memo around it are not underwriting; they are rationalizing. In a higher-for-longer rate environment where Fitch recorded private credit default rates of 9.2% in 2025: a new high, up from 8.1% in 2024; that discipline gap between rigorous and complacent underwriting is where credit losses are born.
The Four-Layer EBITDA Normalization Framework
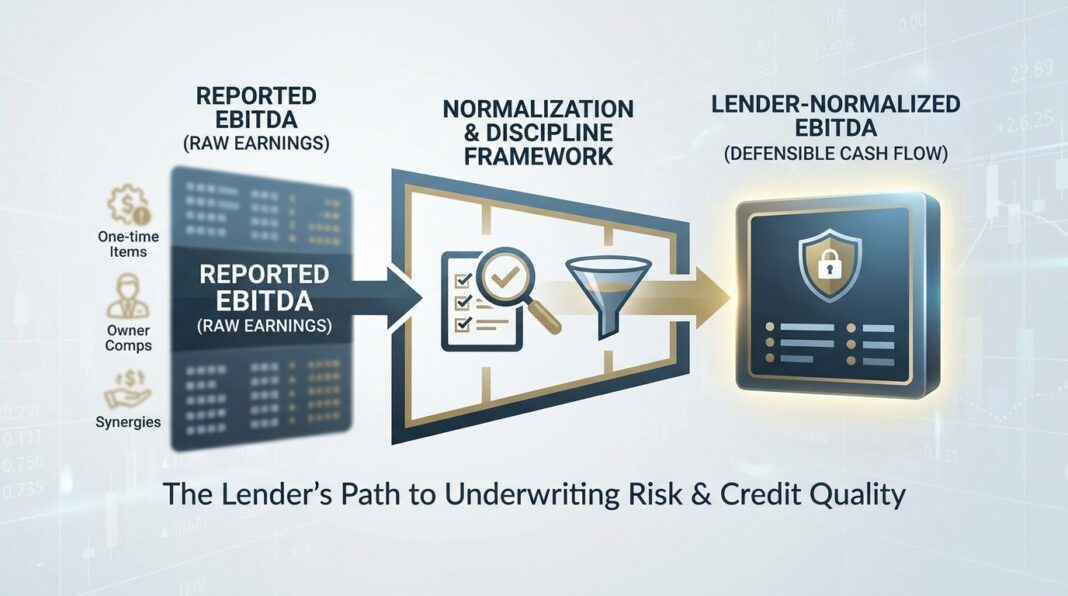
Experienced private credit underwriters distinguish among four distinct earnings figures, each serving a different analytical purpose:
- Reported EBITDA: The figure derived mechanically from audited or reviewed financial statements. It includes all owner-specific economics, one-time charges, and accounting distortions. This is the entry point, not the underwriting number.
- Seller-Adjusted EBITDA: Management’s proposed bridge from reported to “clean” earnings. It reflects every add-back the seller believes is defensible. Experienced underwriters treat this as a negotiating position.
- Lender-Normalized EBITDA: The earnings figure a lender accepts after independently verifying each adjustment against source documentation. This is the number that drives debt sizing, leverage multiples, and covenant thresholds. As a rule of thumb, lenders apply only the most conservative EBITDA definition because it drives debt sizing, covenants, and repayment capacity.
- Stress-Tested EBITDA: Lender-normalized EBITDA run through downside scenarios (revenue compression, margin contraction, or cost structure normalization under new ownership) to test covenant headroom and debt service capacity at the point of maximum stress.
The gap between Layer 2 and Layer 3 is where real underwriting work happens. A credible Quality of Earnings (QoE) analysis is the primary tool for closing that gap. A QoE review commonly evaluates revenue recognition, customer concentration, revenue quality, gross margin trends, add-back support, reserves, accounting cutoffs, working-capital behavior, cash conversion, and the relationship between EBITDA and cash flow. Its purpose is not just to verify arithmetic; it is to determine whether the earnings base used in underwriting is accurate, repeatable, and financeable.
Practitioner Rule: The practical issue is not whether a borrower can identify possible adjustments. The practical issue is whether lenders and investment committees will accept those adjustments as representing recurring economic value.
Walking Through the Numbers: A $10M EBITDA Manufacturing Borrower
Consider a hypothetical mid-market industrial manufacturer presenting the following EBITDA bridge to a prospective lender:
| Line Item | Amount | Lender Verdict |
|---|---|---|
| Reported EBITDA (LTM) | $10,000,000 | Baseline |
| + One-time legal settlement (documented) | $800,000 | ✓ Accept, traceable to court filing |
| + Excess owner compensation vs. market replacement | $600,000 | ✓ Accept (partial), verified via compensation survey; only $400K above market |
| + “Embedded” COVID-era cost savings | $500,000 | ✗ Reject, costs have normalized per trailing P&L; no documentation |
| + Pro forma synergies from pending acquisition | $500,000 | ✗ Reject, acquisition not closed; synergies speculative |
| Seller-Adjusted EBITDA | $12,400,000 | – |
| Lender-Normalized EBITDA | $11,200,000 | After removing $1.2M in unsupported add-backs |
The $1.2M difference is not trivial. At a 5.0x leverage multiple, the seller’s adjusted figure supports $62M in enterprise value and $55.8M in debt. The lender-normalized figure supports $56M in enterprise value and $50.4M in debt. That is a $5.4M difference in permissible debt load, and a material change in every downstream metric.
Key Metrics to Recalculate at Normalized EBITDA
- Total Leverage (Debt/EBITDA): At 4.5x proposed debt of $50.4M ÷ normalized $11.2M = 4.5x. Acceptable within the 4.0x–5.0x benchmark for mid-market LBOs. However, run the adverse case: a 15% EBITDA haircut to $9.52M raises leverage to 5.3x, approaching distress territory.
- Interest Coverage (EBITDA/Interest): At SOFR + 525bps with 3-month SOFR at ~4.3%, all-in rate is ~9.8%. Interest on $50.4M = ~$4.9M. Coverage = $11.2M / $4.9M = 2.3x. Note: the average EBITDA-to-interest coverage ratio in leveraged deals declined to approximately 3.1x in 2024, down from over 4.0x during 2019–2022. A 2.3x entry point leaves limited room for error.
- Fixed Charge Coverage Ratio (FCCR): (EBITDA − Capex − Taxes) / (Interest + Scheduled Amortization). If capex is $800K and taxes are $600K, and amortization is $1.0M: ($11.2M − $800K − $600K) / ($4.9M + $1.0M) = $9.8M / $5.9M = 1.66x. Acceptable, but a 10% EBITDA miss pushes FCCR to ~1.47x, inside many lender covenant thresholds of 1.5x.
- Debt Service Coverage Ratio (DSCR): Normalized cash flow divided by total debt service. Loans with financial covenants are typically breached when borrowers miss financial targets by 20–30%, triggering non-compliance with FCCR and/or debt-to-EBITDA ratios.
What Institutional Lenders Look For, and What the Data Shows
The private credit market crossed $2.1 trillion in AUM for the first time in 2024, and with scale has come sharper scrutiny of underwriting practices. The data from Fitch, Cliffwater, and Moody’s tells a clear story about where EBITDA normalization discipline matters most:
📊 Credit Performance Data Box (2025–2026)
- Sub-$25M EBITDA borrowers defaulted at 15.8% in 2025, while upper-middle-market borrowers above $100M EBITDA defaulted at just 4.0%, nearly a four-times differential based on borrower size alone (Fitch Ratings).
- Fitch’s U.S. Private Credit Default Rate (PCDR) hit 9.2% in 2025, a record high, up from 8.1% in 2024. By January 2026, it had already climbed to 9.4% within the Privately Monitored Ratings universe.
- PIK interest conversions drove 59–60% of Fitch-recorded default events in 2025. As of Q1 2025, 11% of investments valued by Lincoln International included some PIK interest, and of those, 56% had no PIK at underwriting, implying a “shadow default rate” materially above reported figures.
- The Cliffwater Direct Lending Index (CDLI) estimated realized losses for BDC underlying loans at 0.70% for calendar year 2025, below its 20-year average annual loss rate of 1.01%, but concentrated in senior, diversified, larger-EBITDA portfolios.
- Senior secured loan recovery rates have consistently held at 60% or more in default scenarios, versus roughly 40–50% for senior unsecured debt, per Moody’s historical recovery rate data. During the Global Financial Crisis, senior secured recovery rates held at approximately 55–70 cents on the dollar.
- Covenant-lite structures were present in only ~14–15% of direct lending transactions as of year-end 2025, versus approximately 90% in the broadly syndicated loan market. For issuers with EBITDA below $50M, only 3% of loans were covenant-lite, the strongest structural protection tier in private credit.
Common Red Flags That Experienced Lenders Identify
- The EBITDA-to-cash-flow disconnect: If reported EBITDA trends upward while operating cash flow is flat or declining, the improvement is likely accounting-driven, not operational. Reconciling adjusted EBITDA to actual free cash flow is a non-negotiable step in any diligence process.
- Pro forma synergies from unclosed acquisitions: These represent the highest-risk category of add-back. Lenders should reject or heavily discount any adjustment that depends on future execution of a deal or initiative that has not already been demonstrated in trailing results.
- Owner compensation below market replacement cost: A seller who underpays themselves inflates apparent EBITDA. Lenders must model the true cost of replacing the owner’s functional roles, which can push normalized EBITDA significantly below the seller’s adjusted figure.
- Related-party transactions at non-market rates: Rent paid to a seller-owned entity below market, or management fees to a related holding company, must be normalized to market rates, in either direction. Below-market rent is a hidden subsidy that disappears post-close.
- Customer concentration masking revenue quality: A borrower with 40% of revenue concentrated in a single customer may show strong EBITDA, but the effective credit quality of that cash flow is contingent on a single contractual relationship. Lenders should model the loss of that customer in every stress scenario.
- Aggressive add-backs that compound upon each other: Each rejected $100K add-back at a 6x multiple represents $600K of lost enterprise value, but more critically for lenders, it represents a corresponding reduction in permissible debt load and a tightening of every downstream coverage metric.
EBITDA Normalization Underwriting Checklist
Bond Capital’s credit team applies the following diligence framework to every EBITDA adjustment schedule prior to credit committee submission:
Step 1: Document the Reported Baseline
- ▢ Obtain three years of audited or reviewed financial statements plus LTM period
- ▢ Build a trailing revenue, gross margin, and EBITDA bridge year-over-year
- ▢ Reconcile reported EBITDA to operating cash flow from the cash flow statement
- ▢ Flag any periods where EBITDA growth diverges materially from cash conversion
Step 2: Independently Test Each Add-Back
- ▢ Map every add-back to a corresponding source document (legal bill, payroll record, lease agreement, court filing)
- ▢ Apply the three defensibility tests: (1) traceable to source documents, (2) not required to sustain current revenue base, (3) does not duplicate another adjustment elsewhere in the bridge
- ▢ Verify owner compensation against independent compensation surveys for equivalent functional roles
- ▢ Test all related-party transactions (rent, management fees, intercompany services) against market comparables
- ▢ Categorically reject pro forma adjustments for acquisitions not yet closed or initiatives not yet executed
Step 3: Calculate Core Credit Metrics at Normalized EBITDA
- ▢ Total Leverage: Debt / Lender-Normalized EBITDA (benchmark: 4.0x–5.0x for mid-market LBOs)
- ▢ Interest Coverage: Normalized EBITDA / Cash Interest Expense (minimum: 1.5x; target: 2.0x+)
- ▢ FCCR: (Normalized EBITDA − Unfinanced Capex − Cash Taxes) / (Interest + Amortization) (minimum: 1.25x)
- ▢ Free Cash Flow Conversion: (Normalized EBITDA − Total Cash Costs) / Normalized EBITDA
Step 4: Run Stress Scenarios
- ▢ Base Case: Normalized EBITDA, current rate environment, flat revenue growth
- ▢ Adverse Case: 10–15% EBITDA decline (revenue compression or margin pressure), check leverage and FCCR covenant headroom
- ▢ Severe Case: 20–25% EBITDA decline, confirm asset coverage and recovery thesis at current leverage
- ▢ Model rate sensitivity on floating-rate debt: stress SOFR up 100–150bps and recalculate interest coverage
Step 5: Confirm Documentation and Covenant Package
- ▢ Define EBITDA precisely in loan documentation, which add-backs survive into covenant calculations and which are excluded
- ▢ Set maintenance covenants with 20–25% headroom from base case (not from stressed case)
- ▢ Require quarterly financial reporting with EBITDA reconciliation to cash flow
- ▢ Establish clear PIK trigger conditions and limitations to prevent silent deterioration of credit quality
Key Takeaways for Private Credit Underwriters
- Normalized EBITDA is the foundation of every downstream metric. Leverage ratios, interest coverage, covenant thresholds, and debt sizing all flow from the same number. An undisciplined add-back process contaminates every metric that follows it.
- Size matters more than any other single credit variable. Fitch’s 2025 data shows a nearly four-times default rate differential between sub-$25M EBITDA borrowers (15.8%) and upper-middle-market borrowers above $100M EBITDA (4.0%). Portfolio concentration in smaller issuers requires proportionally more conservative underwriting.
- PIK interest is a shadow indicator of credit stress. When PIK conversions account for the majority of default events and when a borrower had no PIK at underwriting, the original EBITDA normalization almost certainly overestimated sustainable free cash flow generation.
- Covenant structure is the lender’s early warning system. Covenant-lite structures are present in only ~14% of direct lending transactions versus ~90% of syndicated loans. Maintaining financial maintenance covenants, particularly in sub-$50M EBITDA deals, gives lenders the ability to engage with a borrower before value deterioration becomes irreversible.
- Stress-test from day one, not after trouble appears. A multi-scenario stress framework applied at underwriting (base, adverse, and severe) should establish the conditions under which the credit breaks. Lenders who only model upside are not underwriting risk; they are pricing hope.


