
Why the Buffer Below Your Loan Matters More Than the Loan Itself
When a private credit lender writes a check to a middle-market company, the question they are really asking is not will this borrower repay?, it is how much can go wrong before I lose money? The answer lives in two related but distinct metrics: the equity cushion and the loan-to-value ratio (LTV). Together, they define the structural buffer that sits between a lender’s principal and a complete loss. Understanding them is foundational for anyone evaluating private credit, whether you are an institutional allocator building a portfolio or a business owner deciding how much leverage to accept.
This article unpacks what equity cushion and LTV mean in practice, shows the math with a concrete example, and connects those concepts to where the market stands in mid-2026.
What Is an Equity Cushion, and Why Does It Exist?
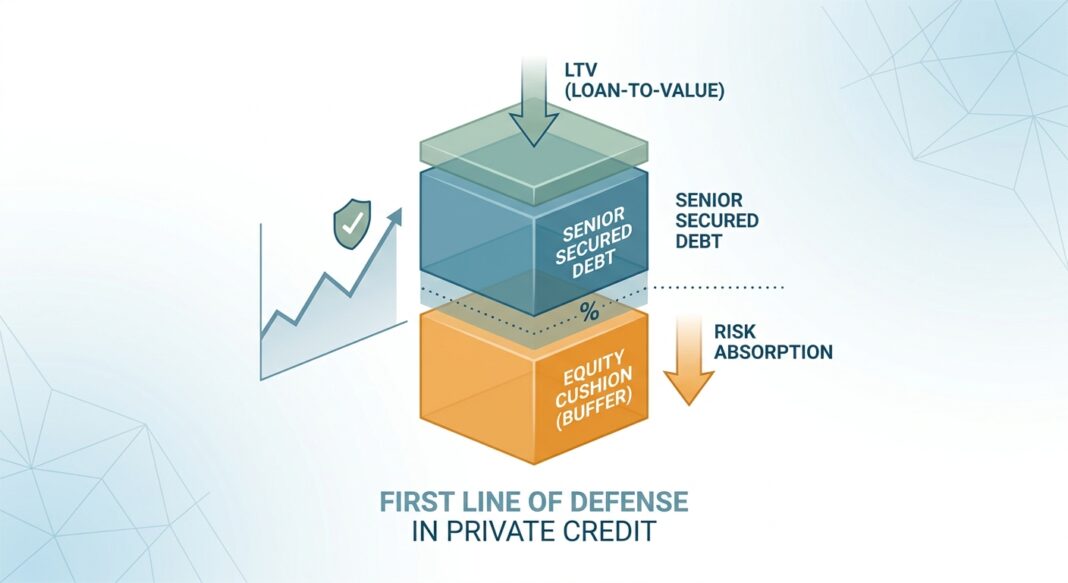
In a leveraged buyout or private credit transaction, a company’s capital structure is layered. At the bottom sits equity: capital contributed by the private equity sponsor or the owner. Above it sits debt, which may include senior secured loans, mezzanine debt, or a unitranche facility. The equity layer absorbs losses first. Only after it is entirely wiped out does the debt layer begin to erode.
The equity cushion is simply the size of that equity layer expressed as a percentage of the company’s total enterprise value (TEV). A larger cushion means the lender has more room to absorb a decline in company value before the loan is impaired. The LTV ratio is the inverse view: it measures total debt divided by total enterprise value, telling you what fraction of the company is funded by borrowing. An LTV of 40% means equity accounts for 60% of value, a substantial cushion. An LTV of 70% means the equity layer is thin and the debt is exposed much earlier.
According to Cliffwater (May 2026), the LTV ratio represents the loan amount divided by the total value of the business, and captures the cushion a lender holds between its debt and the full enterprise value, the buffer that must be erased before the lender suffers principal loss.
How It Works: A Concrete Example
Imagine a private equity sponsor acquires a software-enabled services business for $100 million in total enterprise value. The deal is structured with $50 million of senior secured debt from a direct lender and $50 million of equity contributed by the sponsor.
| Capital Layer | Amount | % of TEV |
|---|---|---|
| Senior Secured Debt (Lender) | $50M | 50% (LTV) |
| Equity (Sponsor) | $50M | 50% (Cushion) |
With a 50% LTV and a 50% equity cushion, the company’s value would need to fall by more than half, from $100 million to below $50 million, before the lender faces any principal loss. That is substantial protection. Now stress the scenario: suppose the company loses a major customer and EBITDA falls 30%, compressing its valuation to $70 million. The lender’s $50 million is still fully covered. The equity holder absorbs the entire $30 million hit. The lender remains whole.
Now contrast this with a thin-cushion deal: same company, but the sponsor only contributes $20 million of equity and borrows $80 million (80% LTV). That same 30% EBITDA decline would reduce enterprise value to $70 million, and now the lender’s $80 million loan is impaired by $10 million. The equity cushion was too thin to absorb the shock.
One important nuance: in middle-market lending, the collateral is not a hard asset like real estate. As Accredited Insight (April 2026) notes, the "cushion" in private credit is derived from an enterprise value multiple applied to cash flows, and both the multiple and the cash flows can compress simultaneously in a downturn. This is why leading lenders focus on companies with durable, recurring revenues rather than cyclical businesses, and why a 50% equity cushion at a volatile industrial company offers less real protection than a 45% cushion at a stable, subscription-based software firm.
Current Market Reality: Where Cushions Stand in Mid-2026
The data from 2025 and early 2026 paints a notably disciplined picture for senior secured direct lending, even as pockets of stress have surfaced elsewhere in the credit markets.
| Metric | Data Point | Source |
|---|---|---|
| Average LTV, senior direct lending (CCLFX portfolio) | ~41% | Swedroe / Cliffwater, Apr 2026 |
| Average LBO equity contribution at origination (2026) | ~50% | Partners Group, May 2026 |
| Average LBO equity contribution at origination (2013) | ~35% | Partners Group, May 2026 |
| Average total debt / EBITDA, US LBOs (2024) | ~4.9x | Private Capital Global / Bain, Sep 2025 |
| CDLI (Cliffwater Direct Lending Index) 2025 annual return | 9.3% | Cliffwater / PR Newswire, Mar 2026 |
| Non-accrual rate (private direct lending, Q4 2025) | ~1.3% of cost | Partners Group, May 2026 |
According to Partners Group (May 2026), average equity contributions at LBO origination have risen steadily over the past decade, moving from approximately 35% in 2013 to around 50% today, meaning sponsors are putting in more capital than at any point in recent history, which directly expands the protective buffer below senior debt.
According to Cliffwater data cited by Larry Swedroe (April 2026), the Cliffwater Corporate Lending Fund holds more than 4,000 unique credits across multiple sectors with an average LTV of just 41%, meaning the average equity cushion protecting that portfolio is approximately 59% of enterprise value.
The Federal Reserve’s April 2026 SLOOS confirms the macro backdrop: banks continued to tighten commercial lending standards in Q1 2026, reporting higher premiums on riskier loans, stricter covenants, and lower maximum credit lines. This ongoing bank retrenchment reinforces private credit’s structural role as the financing source of choice for middle-market borrowers who can no longer rely on traditional bank capacity.
According to StepStone Group (February 2026), direct lending managers entering 2026 have kept leverage and LTVs contained, improved interest coverage ratios, and managed default rates at levels below long-term averages, a positive credit quality signal despite broader market noise.
Decision Framework: Investors and Operators
For Investors Evaluating Private Credit Funds
When assessing a direct lending manager’s portfolio, equity cushion and LTV data are among the most meaningful metrics available. Investors consider the following questions:
- What is the portfolio’s weighted average LTV? Senior secured direct lending portfolios with average LTVs below 50% are generally considered to have meaningful downside protection. An LTV above 65% warrants closer scrutiny of collateral quality and EBITDA stability.
- Is the LTV backed by durable enterprise value or cyclical cash flows? As Accredited Insight (April 2026) explains, middle-market LTV reflects enterprise value, not hard assets, so the quality and predictability of underlying earnings matter as much as the headline ratio.
- What is the average debt / EBITDA leverage multiple? Even a conservative LTV can mask a highly leveraged borrower if EBITDA multiples have been inflated at acquisition. Private Capital Global (September 2025) notes that market discipline has generally kept leverage near 5.0x EBITDA for most transactions, well below the 6.0x+ levels seen in 2018–2019.
- How have non-accruals and realized losses trended? According to Cliffwater (March 2026), the CDLI’s non-accruals and realized losses held steady or improved through full-year 2025, remaining well below historical averages, evidence that disciplined origination and strong equity cushions have translated into actual loss mitigation.
For Business Owners and Operators Seeking Capital
If you are a business owner evaluating private credit as a financing source, equity cushion math works in reverse; it describes what you are giving up in control and upside. Key considerations include:
- Understand your implied LTV before you negotiate. A lender pricing your business at $50M enterprise value and offering a $35M loan is operating at 70% LTV, thin cushion, which typically means stricter covenants and less flexibility during stress.
- Higher equity contribution lowers your cost of debt. According to Lord Abbett (June 2026), the 2026 credit environment has shifted lender-friendly, with new loans increasingly structured with less leverage, more covenants, and tighter documentation. Operators who come to the table with stronger equity bases often access better pricing and more flexible terms.
- Covenant headroom is tied directly to cushion size. A larger equity buffer at origination typically corresponds to more covenant headroom, giving operators room to manage through a downturn without triggering a technical default or lender intervention.
Key Takeaways
- The equity cushion is the lender’s first and most important line of defense. It represents the capital that must be fully lost before a senior secured lender faces any principal impairment.
- LTV ratios in senior direct lending have remained disciplined. Market data from Cliffwater (2026) shows average LTVs near 41% in leading senior secured portfolios, reflecting a 59% equity buffer, historically strong protection levels.
- Sponsor equity contributions have trended upward over a decade. Average LBO equity at origination has risen from roughly 35% in 2013 to approximately 50% today (Partners Group, May 2026), meaningfully expanding cushions relative to prior credit cycles.
- Middle-market LTV is not the same as real estate LTV. The collateral is enterprise value, an EBITDA multiple, not a hard asset. Both the multiple and the cash flow can compress simultaneously, which is why business quality and sector stability matter alongside the headline LTV number.
- Bank tightening creates private credit opportunity, but demands structural discipline. Ongoing bank retrenchment (Federal Reserve SLOOS, April 2026) expands the addressable market for direct lenders, but the discipline of maintaining conservative LTVs and adequate equity cushions remains the core mechanism through which private credit managers protect investor capital across market cycles.


