
Bond Capital | Underwriting & Risk Management | July 15, 2026
EBITDA Adjustments and Normalization: The Credit Underwriter’s First Line of Defense
A borrower’s management-prepared EBITDA figure is a starting position, not a conclusion. Here is the framework that separates defensible earnings from inflated ones.
The Underwriting Challenge
A sponsor submits a Confidential Information Memorandum showing a $10 million EBITDA manufacturing company. The leverage multiple looks comfortable at 4.5x. The coverage ratios pass your initial screen. Then you open the add-back schedule.
There are fourteen line items. Among them: $800,000 in “non-recurring” legal fees that have appeared for three consecutive years, $600,000 in projected cost savings from a restructuring that has not yet begun, $400,000 in owner compensation normalized to a market replacement wage, and $300,000 in COVID-era losses still being added back in 2026. Before any diligence is done, the seller is already claiming $2.1 million in adjustments: adjustments that, if accepted wholesale, would reduce your perceived leverage from a real 6.3x to a cosmetic 4.5x.
This gap between reported EBITDA and the earnings figure a lender is actually underwriting is the central credit risk in modern leveraged finance. Getting the EBITDA normalization right is not a mechanical exercise; it is the analytical foundation upon which every downstream metric rests: leverage ratios, coverage tests, covenant headroom, debt capacity, and ultimate recovery. Lenders that accept inflated adjustments are not just mispricing one loan. They are compromising the structural integrity of their entire portfolio.
The current market environment sharpens this discipline. Moody’s reports that the approximated default rate for private credit in 2025 was in the range of roughly 1.6% to 4.7%, with distressed restructurings accounting for approximately 65% of all defaults, and the Proskauer Private Credit Default Index recorded a 2.73% default rate in Q1 2026, up from 1.84% just two quarters earlier. Many of those deteriorations trace back to earnings that were never as strong as the original underwriting assumed.
The Analytical Framework: From Reported to Lender-Accepted EBITDA
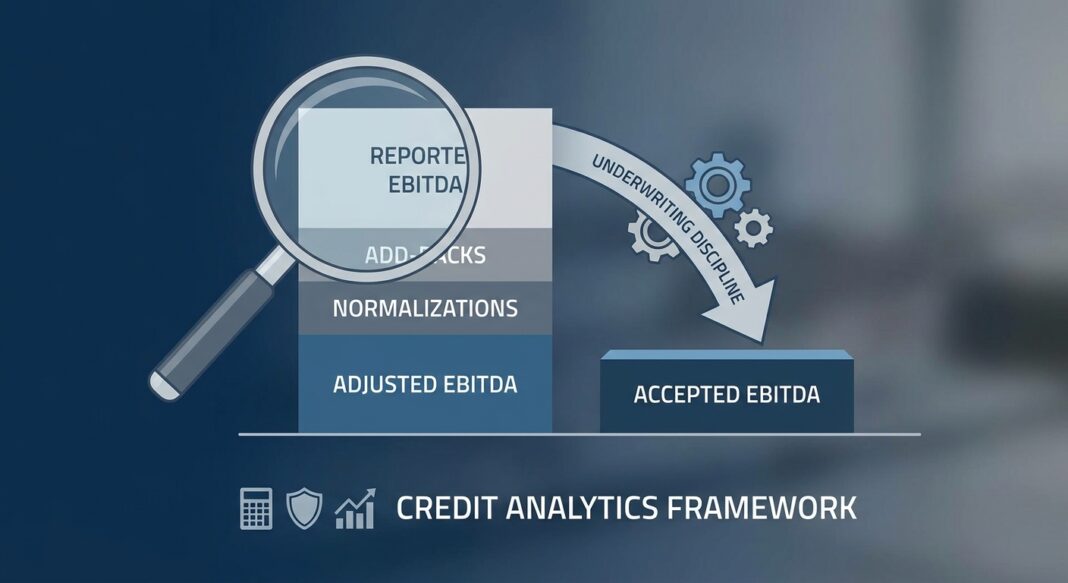
Rigorous normalization requires working through a structured hierarchy of adjustments. The process moves from reported EBITDA toward a lender-accepted normalized figure, and the discipline lies in which adjustments survive that journey.
Step 1: Establish the Reported EBITDA Baseline
Begin with audited or reviewed financial statements. Use trailing twelve months (TTM) as your primary period, then cross-reference against the three prior fiscal years. Single-year EBITDA is vulnerable to timing distortions; multi-year analysis reveals trends in margins, revenue quality, and cost structure that a snapshot obscures.
Step 2: Apply the Add-Back Hierarchy
Not all add-backs carry equal legitimacy. A practitioner-grade hierarchy moves from highest to lowest defensibility:
- Tier 1, Standard Non-Cash Charges: Depreciation, amortization, stock-based compensation. These are universally accepted and require minimal support.
- Tier 2, Documented One-Time Events: Litigation settlements with supporting legal invoices, acquisition transaction costs with banker engagement letters, discrete severance tied to a named reduction-in-force. Each must be supported by third-party documentation and must not recur in the historical record.
- Tier 3, Owner-Specific Normalizations: Excess owner compensation above a documented market replacement wage, personal expenses run through the business (personal travel, family vehicles, club memberships), related-party rent above or below market. These are common and legitimate in owner-operated businesses but require market benchmarking and clear documentation.
- Tier 4, Pro Forma and Forward-Looking Adjustments: Cost savings from an announced restructuring, synergies from a completed acquisition, run-rate revenue from a new contract. These carry the highest scrutiny because they represent earnings that do not yet exist in the historical record.
The key underwriting principle: lenders should only accept adjustments that are truly non-recurring, documented, and consistent with how the business will actually operate post-close. As practitioners at Auxo Capital frame it, the purpose of a Quality of Earnings review is to determine whether the earnings base used in valuation is accurate, repeatable, and financeable.
Step 3: Apply Add-Downs
This step is systematically neglected. Normalized EBITDA can be lower than reported EBITDA. If the business benefits from below-market related-party rent, or if owner labor is underpaid relative to a market replacement, a lender must normalize costs upward, reducing EBITDA. A credible normalization analysis includes both add-backs and add-downs.
Step 4: Quality of Earnings Validation
A Quality of Earnings (QoE) analysis is the diligence process that tests the entire earnings bridge. A QoE review should evaluate revenue recognition policies, customer concentration risk, gross margin trends, add-back support and documentation, accounting cutoffs, working-capital behavior, cash conversion, and the relationship between EBITDA and free cash flow. Critically, EBITDA and operating cash flow should track each other over time. Where they diverge materially, the divergence is a diagnostic signal, not background noise.
The Analysis: Walking a $10M EBITDA Manufacturing Company
Consider the following illustrative normalization bridge for a hypothetical middle-market industrial manufacturer:
| Line Item | Amount | Lender Verdict | Rationale |
|---|---|---|---|
| Reported EBITDA (TTM) | $7,900,000 | Baseline | Audited financials, FY2025 |
| + Depreciation & Amortization | $1,200,000 | ✅ Accept | Tier 1; standard non-cash |
| + One-time legal settlement (documented) | $350,000 | ✅ Accept (50%) | Appears twice in prior 3 years, partial acceptance only |
| + Excess owner compensation | $400,000 | ✅ Accept | Market comp benchmarked at $250K; $150K excess accepted |
| + “Non-recurring” consulting fees | $600,000 | ❌ Reject | Same line item present all 3 years, recurring in practice |
| + Projected restructuring savings | $900,000 | ❌ Reject | No implementation evidence; no historical comparable; forward-looking only |
| − Below-market related-party rent | ($180,000) | ⬇ Add-Down | Owner rents facility to company at 40% below market; normalized upward |
| Lender-Accepted Normalized EBITDA | $10,170,000 | Vs. seller-claimed $12,350,000 |
In this example, the lender’s normalized EBITDA of ~$10.2 million versus the seller’s claimed $12.35 million is a difference of $2.18 million. On a proposed $45 million debt structure, that single discrepancy moves leverage from a seller-claimed 3.6x to a lender-assessed 4.4x: a material difference for covenants, pricing, and approval.
The valuation mechanics compound this. A rejected $100,000 add-back at a 6.0x EBITDA multiple costs $600,000 in enterprise value. Every disputed add-back is simultaneously an underwriting risk and a deal-pricing variable.
Downstream Metric Check
With lender-accepted EBITDA established, run your core credit metrics:
- Total Debt / EBITDA (Leverage): Should not exceed 6.0x for most industries. Per Interagency Leveraged Lending Guidance from the Federal Reserve, leverage in excess of 6x Total Debt/EBITDA raises concerns for most industries.
- EBITDA / Interest Expense (Interest Coverage): Minimum 2.0x–2.5x for leveraged credits; below 1.5x triggers serious concern.
- EBITDA − Capex / Debt Service (Fixed Charge Coverage): The truest measure of cash-generative capacity; must exceed 1.1x to demonstrate a credible cushion.
- Free Cash Flow Conversion: EBITDA that does not convert to cash flow (due to high working capital consumption, deferred capex, or aggressive accruals) is structurally weak even if nominally compliant.
Regulators provide a useful repayment benchmark: supervisors commonly assess whether a borrower can fully amortize senior secured debt or repay at least 50% of total debt over a five-to-seven-year period. If refinancing is the only viable exit for the lender, that is an adverse signal regardless of current compliance metrics.
Industry Standards: What Institutional Lenders Look For in 2026
The Add-Back Inflation Problem
Aggressive EBITDA add-backs are not a new phenomenon, but they have become a systemic risk. The Financial Stability Board and rating agencies have documented that headline debt-to-EBITDA ratios in leveraged transactions may be understated because add-backs for synergies and operational improvements are uncertain in both magnitude and timing. During 2020–2021, many PE-backed borrowers added back “COVID-related losses” representing 30–40% of reported EBITDA, masking true leverage. Sophisticated lenders now scrutinize add-back quality and limit cumulative adjustments, typically capping restructuring-related add-backs at 15–20% of EBITDA.
Lenders in today’s environment are also increasingly focused on how EBITDA translates to free cash flows and how recurring and predictable that translation is. Scenario-tested cash flow models, aligned with demonstrated operating history, are now an expectation, not a differentiator, for high-quality underwriting.
Covenant Design: Protecting the Earnings Floor
Maintenance covenants are the mechanical enforcement of normalized EBITDA discipline. They work only if the EBITDA definition in the credit agreement is tightly defined. The most common financial covenants in middle-market private credit are a maximum total leverage ratio (Total Debt / EBITDA ≤ 5.0x–6.0x) and a minimum interest coverage ratio (EBITDA / Interest ≥ 2.0x–2.5x). Step-down provisions are standard: leverage covenants typically decrease over time (for example, 6.5x Year 1, 6.0x Year 2, 5.5x Year 3+), reflecting expected deleveraging as the business performs.
Private credit loans carrying maintenance covenants provide an early warning system and negotiating leverage that covenant-lite lenders simply do not have. Covenant breaches typically surface 12–18 months before payment failures, when the business can still be restructured.
The cost of loose covenant documentation is measurable. S&P research has shown that covenant-lite loans have historically recovered at approximately 66 cents on the dollar versus approximately 75.5 cents for non-covenant-lite loans, a nearly 10-point differential in recovery value that is attributable directly to documentation quality.
📊 Data Box: Credit Performance Benchmarks (2025–2026)
- Private Credit Default Rate (2025): Approximately 1.6%–4.7%, depending on whether distressed exchanges are included, Moody’s, April 2026
- Proskauer Private Credit Default Index (Q1 2026): 2.73%, tracking 697 loans totaling $189.2 billion, up from 1.84% just two quarters earlier, Forbes / Proskauer, May 2026
- Distressed Restructurings as % of All 2025 Defaults: ~65%, Moody’s
- First-Lien Senior Secured Recovery Rate (Current Expected): 60%–70% on a base-case basis, down from a historical 70%–80%, CLO Recovery Rate Database, 2026
- Cov-Lite vs. Non-Cov-Lite Recovery Differential: ~66% vs. ~75.5%, Financial Stability Board / S&P
- Regulatory Leverage Concern Threshold: Total Debt / EBITDA above 6x raises concerns for most industries, Federal Reserve Interagency Guidance
- U.S. Leveraged Loan Default Rate at Late 2024 Peak: 5.6%, driven largely by distressed exchanges, FTI Consulting 2025 Leveraged Loan Survey
Red Flags in EBITDA Normalization
- 🚩 “Non-recurring” items that recur: Legal fees, consulting charges, or IT costs that appear in the add-back schedule for two or more consecutive years are not one-time; they are operating expenses the seller is trying to re-classify.
- 🚩 Add-backs exceeding 20%–25% of reported EBITDA: At this level, the adjusted figure bears little relationship to the company’s actual operating performance.
- 🚩 Pro forma synergies with no implementation evidence: Cost savings that have not begun (and for which no project plan, vendor engagement, or headcount reduction has occurred) should be rejected until performance is demonstrated.
- 🚩 EBITDA growing while operating cash flow is flat or declining: This divergence almost always signals aggressive accruals, working capital deterioration, or deferred maintenance capex inflating the earnings figure.
- 🚩 Loose EBITDA definition in the credit agreement: If the permitted add-back basket is open-ended or uncapped, the borrower retains the ability to inflate covenant EBITDA even as the business deteriorates, eroding the protective function of every financial test in the document.
Underwriting Checklist: EBITDA Normalization Diligence Points
Documentation Requirements
- Audited or reviewed financial statements for the trailing three fiscal years plus LTM period
- Seller-prepared EBITDA bridge with line-item support for every add-back
- Third-party Quality of Earnings report from a qualified accounting firm
- Market compensation benchmarking study for owner and key management roles
- Lease agreements and related-party transaction disclosures for rent normalization
- Invoices, legal correspondence, or board resolutions supporting all Tier 2 add-backs
- Customer concentration analysis: top 5 and top 10 customers as % of revenue
- Three years of monthly cash flow statements to test EBITDA-to-cash conversion
Questions to Ask in Diligence
- Has each add-back item appeared in any prior year? If so, why is it non-recurring?
- What is the EBITDA-to-free cash flow conversion ratio over the past three years?
- Are there off-balance-sheet obligations (operating leases, earn-outs, contingent liabilities) that reduce true cash earnings?
- Has any revenue been pulled forward through aggressive recognition policies?
- What is the steady-state capex requirement of the business, and is it being deferred?
- Do gross margins and revenue trends support the EBITDA trajectory, or does EBITDA growth come primarily from add-backs?
- Has the business met its own prior projections? Management credibility is a direct underwriting input.
Credit Agreement Protections
- Define EBITDA explicitly in the credit agreement with a capped add-back basket
- Limit restructuring and cost-savings add-backs to 15–20% of EBITDA with a 12-month sunset
- Require quarterly financial reporting and covenant compliance certificates
- Include step-down leverage covenants to enforce deleveraging over the loan term
- Negotiate equity cure rights with clear caps and frequency limits to prevent covenant manipulation
Key Takeaways
- 🎯 Management-prepared EBITDA is a starting position: The lender’s job is to independently validate, challenge, and reconstruct the earnings figure through documented diligence, not to accept the seller’s bridge at face value.
- 🎯 Add-downs are as important as add-backs: Normalized EBITDA can be lower than reported EBITDA when below-market related-party arrangements or understated management costs are corrected. A credible earnings bridge runs in both directions.
- 🎯 EBITDA-to-cash conversion is the ultimate diagnostic: Divergence between EBITDA growth and operating cash flow is one of the most reliable red flags in credit underwriting, signal, not noise.
- 🎯 Covenant definitions are underwriting instruments: An open-ended EBITDA definition in the credit agreement allows the borrower to inflate covenant headroom even as the business deteriorates. Tight definitional language is a structural protection, not a negotiating concession.
- 🎯 Recovery rates are declining, EBITDA discipline matters more, not less: With first-lien senior secured recovery rates drifting toward 60%–70% from a historical 70%–80%, and private credit default rates rising, the margin for error in original underwriting has narrowed. Getting the earnings base right at origination is the primary defense against realized credit loss.


