
Underwriting & Risk Management | Bond Capital
July 14, 2026
The Underwriting Question That Matters Most
A sponsor presents a confidential information memorandum for a $45 million senior secured term loan. The borrower, a specialty manufacturing business, shows $10.2 million in management-adjusted EBITDA, implying a leverage multiple of 4.4x. The pitch is clean: a handful of one-time items, a modest owner compensation normalization, and a recent cost reduction initiative. The deal appears to work.
But what is the underwritable EBITDA? That is a different question entirely.
The EBITDA figure on page three of any CIM is a seller-constructed number. Its purpose, however legitimately executed, is to present the business in the most favorable possible light. The credit underwriter’s job is the inverse: to reconstruct the earnings base from the bottom up, challenge every adjustment, and arrive at a number a lender can defend under base case, stress case, and downside scenarios.
In the current environment, that discipline is more consequential than ever. Proskauer’s Private Credit Default Index, tracking 697 loans totaling $189.2 billion, recorded a 2.73% default rate in Q1 2026, up from 1.84% just two quarters earlier. Deteriorating earnings quality at origination is among the structural contributors. This article provides the analytical framework to prevent it.
The Framework: Four Layers of EBITDA Scrutiny
Experienced credit underwriters do not simply validate or reject a management add-back schedule. They subject reported financials to four distinct analytical layers before arriving at an underwritable earnings figure.
Layer 1: Reported EBITDA (The Baseline)
Start with audited or reviewed financial statements. Calculate EBITDA from the income statement: Net Income + Interest Expense + Income Taxes + Depreciation + Amortization. This is your anchor. Any figure above this line requires documented justification. Note that reported EBITDA in a closely held company almost always reflects the owner’s personal financial decisions as much as business performance, making the subsequent adjustment process structurally essential, not optional.
Layer 2: Management Adjusted EBITDA (The Seller’s Case)
Review every add-back the seller or sponsor has claimed. Common categories include: excess owner compensation above market replacement cost, one-time legal settlements, transaction expenses, non-recurring severance and restructuring costs, and related-party rent or management fee normalization. Per industry practice, a credible adjusted EBITDA schedule includes both addbacks and adddowns, even if sellers tend to focus on the addback side, meaning sub-market related-party rent or an underpaid owner role that requires a more expensive replacement must reduce the claimed figure.
Layer 3: Normalized EBITDA (The Buyer-Underwritten Figure)
This is where the underwriter’s work begins in earnest. Buyers often distinguish normalized EBITDA as the earnings a buyer can sustainably underwrite after considering steady-state staffing, market compensation, and necessary reinvestment. This figure can (and often should) be lower than management’s adjusted EBITDA. The test is not whether an adjustment is labeled as one-time; it is whether the underlying economic reality of the business supports the claim.
Layer 4: Underwritable EBITDA (The Lender’s Conservative Anchor)
The final number used for debt sizing, covenant setting, and stress testing. It incorporates any haircuts applied to disputed or speculative adjustments and represents the earnings floor the lender is prepared to defend to a credit committee. The standard for acceptance is traceability and reasonableness, can the adjustment be traced to records, is the rationale clear, and would the cost truly disappear under new ownership?
Walking Through the Calculations: A $10M EBITDA Manufacturing Borrower
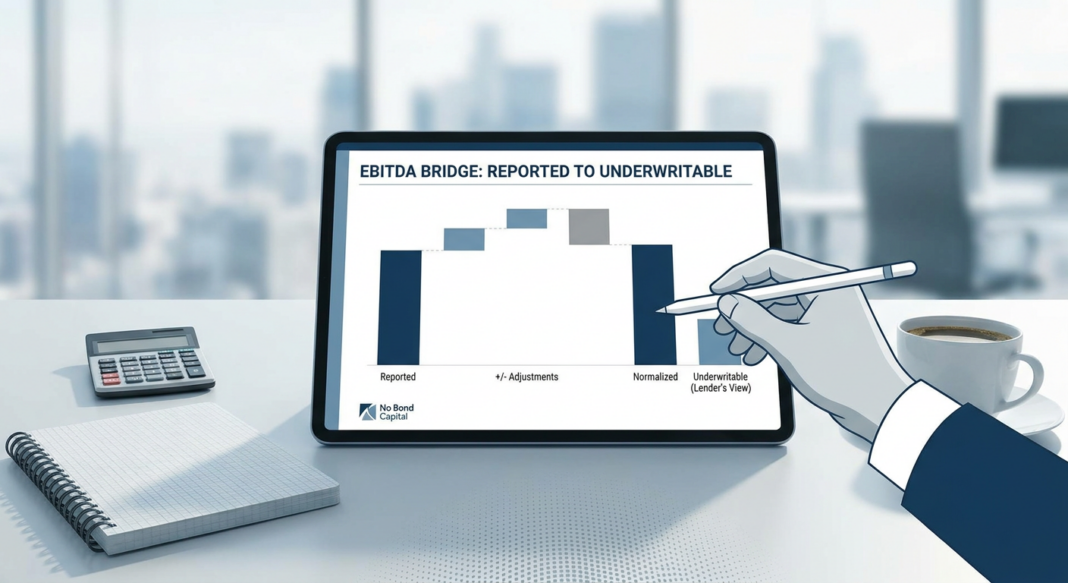
Consider a specialty manufacturer presenting the following earnings bridge ahead of a leveraged buyout financing:
| Line Item | Seller Claim ($000s) | Underwriter Assessment ($000s) |
|---|---|---|
| Reported EBITDA (TTM Audited) | $8,400 | $8,400 |
| + Owner Compensation Normalization | $900 | $600 (market replacement: $300K) |
| + One-Time Legal Settlement | $250 | $250 (documented, resolved) |
| + Transaction Expenses | $180 | $180 (confirmed non-recurring) |
| + “Operational Efficiency” Savings (Projected) | $470 | $0 (post-close; no track record) |
| – Below-Market Related-Party Rent (Adddown) | $0 | ($220) (market rate normalization) |
| = Adjusted / Normalized EBITDA | $10,200 | $9,210 |
The delta ($990,000) is not immaterial. At a 4.5x leverage multiple applied to underwritable EBITDA, the defensible debt capacity is $41.4 million, not $45.9 million. That $4.5 million difference determines whether the deal is fundable at the proposed structure. As one industry benchmark illustrates: a single rejected $100K addback at a 6x multiple costs $600K in enterprise value, and in a credit context, that same logic governs maximum supportable debt. If an “exceptional” cost appears every year, it is no longer exceptional and must be excluded from the normalization schedule.
Additionally, the underwriter must bridge EBITDA to Free Cash Flow to Debt Service (FCFDS), which requires:
- Subtracting maintenance capital expenditures (not growth capex claimed as non-recurring)
- Adjusting for working capital seasonality and cash conversion cycle
- Calculating cash interest and required amortization against the proposed structure
- Arriving at a Debt Service Coverage Ratio (DSCR), the threshold most institutional lenders require above 1.20x in base case and above 1.00x in a defined downside scenario
If EBITDA normalization is overly aggressive, DSCR may appear acceptable on paper but fail during underwriting, a finding that kills deals and destroys lender credibility with credit committees.
What Institutional Lenders Look For: Standards, Data, and Red Flags
The Current Credit Environment
The stakes of poor EBITDA normalization have never been higher. Leverage in the private credit market has pushed default metrics well above historical averages. According to Moody’s 2025 credit analysis, leveraged loan default rates are already nearly double the 3.4% historical average, and were projected to reach 7.9% in Q1 2026. Separately, Moody’s estimates that distressed restructurings accounted for roughly 65% of all 2025 private credit defaults, a structural feature that masks true credit deterioration in headline statistics.
On the recovery side, the buffer that underwriters have historically relied upon is also compressing. Moody’s has estimated expected ultimate recoveries on U.S. first-lien loans at roughly 68%, versus long-run historical experience in the high 70s. This decline is driven by loan-only capital structures, covenant-lite documentation, and the prevalence of asset-light borrowers whose enterprise value can deteriorate rapidly in distress.
📊 Credit Performance Data Box
- Leveraged loan default rate (Moody’s, projected Q1 2026): 7.9%, nearly 2.3x the 3.4% historical average (Source: Moody’s Credit Strategy, July 2025)
- Private credit default rate (Proskauer Index, Q1 2026): 2.73% on 697 loans / $189.2B, up from 1.84% two quarters prior (Source: Forbes / Proskauer, May 2026)
- Distressed exchange share of defaults (2025): ~65% of all private credit default events (Source: Moody’s via Forbes, May 2026)
- First-lien loan expected recovery (current): ~68% vs. historical high-70s average (Source: Moody’s Ultimate Recovery Database, 2026)
- QoE / EBITDA discrepancies as deal failure cause: account for nearly half of all failed M&A transactions (Source: CLA Connect, 2026)
The Five Most Common Red Flags in EBITDA Normalization
- Projected cost saves with no implementation history. Anticipated cost savings may be rejected if they depend on post-closing actions, particularly when the savings require headcount reductions, vendor renegotiations, or technology changes that have not been initiated.
- Owner compensation normalized far above market replacement. Normalization commonly adds 15 to 40 percent to reported EBITDA in closely held businesses where owner compensation exceeds a market replacement salary, but only the excess above a documented market rate is a defensible add-back.
- The same “one-time” item appearing in multiple periods. Three years of litigation expense is not non-recurring; it is the cost of doing business in a contentious sector.
- Revenue concentration in a single customer or contract. The QoE must interrogate revenue quality: timing, contract terms, churn, and concentration. A business with 40% of revenue from one customer carries a fundamentally different risk profile than its EBITDA margin implies.
- EBITDA-to-cash-flow divergence. If EBITDA rises but operating cash flow does not track it, that is a signal the improved earnings are on paper, not in cash, potentially reflecting accounting changes, timing differences, or working capital manipulation.
Bond Capital’s EBITDA Normalization Underwriting Checklist
Use this framework at origination, during credit committee preparation, and as part of ongoing portfolio monitoring:
✅ Documentation Requirements
- Three full fiscal years of audited or reviewed financial statements (minimum)
- Trailing twelve month (TTM) financial statements, updated within 90 days of close
- Independent Quality of Earnings report from a recognized accounting firm, standard practice for transactions above $2M EBITDA
- Management-prepared EBITDA bridge with supporting documentation for every line item
- Payroll records, W-2s, or equivalent to support owner compensation normalization
- Market comparables or independent appraisals for related-party rent adjustments
- Legal correspondence confirming resolution of all claimed one-time litigation items
✅ Analytical Steps
- Anchor to audited reported EBITDA. Build your bridge independently, do not start from management’s adjusted number.
- Test every add-back against three criteria: Is it real? Is it evidenced? Will it stay out after closing? (Buyers test whether each adjustment is real, evidenced, and likely to stay out after the deal.)
- Apply adddowns proactively. Below-market rent, underpaid management, deferred maintenance, and unfunded obligations must reduce your normalized EBITDA figure.
- Run the DSCR at three scenarios: Base case (management case with haircuts), stress case (revenue -15%, margin -200bps), and downside (revenue -25%, major customer loss).
- Reconcile EBITDA to operating cash flow over the last three years. Flag any period where the gap exceeds 15% of EBITDA.
- Size debt to underwritable EBITDA, not management-adjusted EBITDA. The spread between the two is your margin of safety, do not lend it away.
✅ Questions to Ask Management
- Has any “one-time” cost category appeared in more than one of the past three fiscal years?
- What is the total cost of replacing all owner-related roles at market compensation rates?
- What percentage of projected cost savings are already reflected in the current run rate?
- What is the customer concentration in the top five customers, and what is the contract renewal profile?
- Are there any contingent liabilities, earn-out obligations, or off-balance-sheet commitments not reflected in reported EBITDA?
Key Takeaways for Credit Underwriters
- 📌 The seller’s adjusted EBITDA is a starting point, not a conclusion. Institutional lenders independently reconstruct the earnings base. Add-back schedules presented without documentation are a risk signal, not a shortcut.
- 📌 Adddowns are as important as addbacks. Related-party rent at sub-market rates, underpaid owner roles, and deferred capex all reduce true earnings power, and must be reflected in the underwritable EBITDA figure.
- 📌 EBITDA is a proxy for cash flow, not a substitute for it. Every underwriting must bridge normalized EBITDA to DSCR using actual cash taxes, maintenance capex, and working capital requirements. DSCR below 1.20x in base case warrants structural protection or deal repricing.
- 📌 The current credit environment demands more conservatism, not less. With leveraged loan default rates running near double their historical averages, and first-lien recovery rates compressing below historical norms, the margin of error in EBITDA normalization is razor-thin.
- 📌 Normalization discipline is portfolio management, not just deal-level diligence. EBITDA inflation at origination compounds over the life of a credit: inflated leverage multiples, weakened covenant headroom, and understated default risk follow the borrower through every annual review. Getting the earnings base right at close is the most important risk decision a lender makes.


