
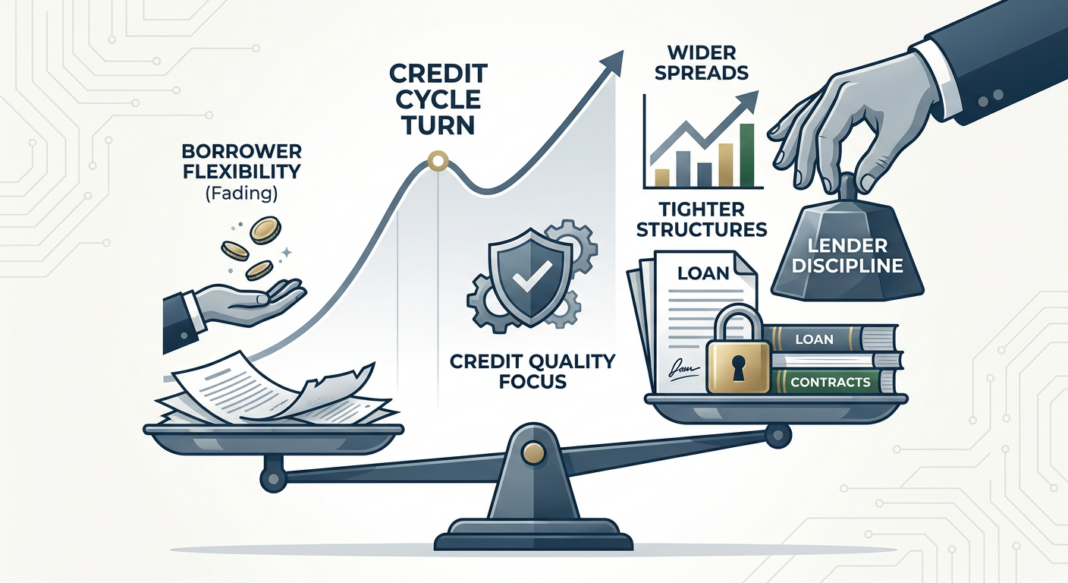
Market Headline: The Credit Cycle Has Turned, Lenders Are Back in the Driver’s Seat
The defining story of mid-2026 credit markets is not simply that rates have stayed higher for longer; it is that the structural balance of power between borrowers and lenders has shifted. After two years in which abundant private credit capital chased a limited deal pool and borrowers dictated terms, the market has reset. Spreads are wider, covenants are back, PIK requests are down, and documentation is tighter. For disciplined institutional lenders with dry powder, this is the environment they were waiting for. For over-leveraged borrowers and undisciplined managers from the 2021–2022 vintage, the reckoning has begun.
Three macro forces are driving this reset simultaneously. First, inflation has re-accelerated: headline CPI reached 4.2% in May 2026, a three-year high, while core PCE held at 3.4%, keeping the Federal Reserve anchored at its 3.50%–3.75% target range with futures markets pricing a near-certain hold through the summer. Second, AI disruption has bifurcated the leveraged loan universe, with software sector secondary spreads running approximately 245 basis points wider than year-end 2025 levels on a B-rated basis, according to PitchBook LCD data. Third, geopolitical shocks from the Middle East conflict have introduced persistent energy price pressure and supply-chain uncertainty across industrial and energy-intensive sectors, forcing lenders to tighten underwriting for businesses whose leverage was predicated on stable input costs.
The result: private credit has crossed $2 trillion in global assets under management, but the easy money phase is over. What follows is a granular, data-driven breakdown of where spreads, structures, and lender appetite stand today.
Quantitative Market Snapshot
The table below consolidates current pricing, policy, and structural data from primary institutional sources. All data is as of Q2 2026 unless otherwise noted.
| Metric | Current Level | Prior Period | Change | Source |
|---|---|---|---|---|
| Middle Market Private Credit Spreads (Unitranche) | SOFR + 475–550 bps | SOFR + 450–525 bps (YE 2025) | +25 bps at midpoint | VRC Q2 2026 |
| Direct Lending All-In Asset Yield | ~8.0%–8.5% (first lien) | ~9.0%–9.5% (H1 2025) | Declining on rate compression | Morgan Stanley IM |
| Spread Widening Since Late 2025 (Private Credit) | +50 to +100 bps | Near record tights (Q3 2025) | Widening | Lord Abbett / PitchBook |
| B-Rated Secondary Loan Spreads | ~+43 bps vs. YE 2025 (broad); Software: +245 bps vs. YE 2025 | Year-end 2025 baseline | Software severely dislocated | PitchBook LCD / VRC |
| Fed Funds Rate (FOMC) | 3.50%–3.75% | 3.50%–3.75% (on hold) | No cuts; higher-for-longer confirmed | Federal Reserve / FRED |
| Bank C&I Lending Standards (Large/Mid-Market) | Net 8.1% tightening | Q1 2026: Modest net tightening | Continued tightening trend | Fed SLOOS Q2 2026 (FRED) |
| Middle Market Debt/EBITDA (Reported) | ~4.0x–5.0x (reported); up to ~7x ‘true’ leverage | 6.0x+ (2018–2019 peak) | Structural gap between reported and adjusted | FSB May 2026 Vulnerabilities Report |
| EBITDA-to-Interest Coverage (Leveraged Deals) | ~3.1x (2024); improving modestly in 2026 | 4.0x+ (2019–2022) | Compressed by elevated base rates | Private Capital Global |
| Private Credit AUM (Global) | >$2.0 trillion | ~$1.5 trillion (end-2024) | Rapid expansion | Moody’s / FSB |
| Private Credit Default Rate Range (2025) | ~1.6%–4.7% (excl. distressed exchanges) | ~2.0%–2.5% (historical average) | Elevated; PIK masking true stress | Moody’s |
Data Box compiled by Bond Capital Market & Sector Intelligence. Sources: Federal Reserve SLOOS (FRED), VRC Q2 2026, Lord Abbett/PitchBook, Morgan Stanley IM, FSB Vulnerabilities Report (May 2026), Moody’s. All figures are approximate and sourced from the most recently available institutional data as of July 13, 2026.
The Macro-to-Micro Credit Cycle: What the SLOOS and Spread Data Are Telling Us
The Federal Reserve’s April 2026 Senior Loan Officer Opinion Survey (SLOOS): the most authoritative real-time read on bank credit availability, delivered a clear signal: the tightening cycle in commercial lending has not ended. The net percentage of domestic banks tightening standards for C&I loans to large and middle-market firms reached 8.1% in Q2 2026, with large banks reporting a net 10.0% tightening. Banks simultaneously reported tighter loan covenants, higher premiums on riskier loans, and stricter collateralization requirements. For non-depository financial institutions (NDFIs) (which include private equity funds and private credit vehicles) banks reported tighter standards across all loan categories over the past year, with significant net shares citing higher risk premiums, stricter covenants, shorter maturities, and lower maximum credit line sizes.
This is not a crisis signal; it is a mid-cycle recalibration. Bank standards were historically loose during the 2024–2025 borrower-friendly window. What the SLOOS now reflects is a return to more disciplined underwriting, catalyzed by sticky inflation, AI-related sector uncertainty, and geopolitical energy price risk. The SOFR forward curve, per Chatham Financial and Northleaf Capital data, implies a base rate of approximately 3.5% through 2028, roughly 20 basis points higher than market expectations just one quarter ago, effectively confirming that rate relief for floating-rate borrowers has been deferred, not delivered.
For private credit, this bank tightening is a structural tailwind: as banks retreat from leveraged C&I and NDFI lending, private lenders capture incremental flow. But the data also contain a critical warning for operators and borrowers: EBITDA-to-interest coverage ratios in leveraged deals have compressed to approximately 3.1x, down from over 4.0x in the 2019–2022 era, as elevated base rates continue to pressure fixed charge coverage. The FSB’s May 2026 Vulnerabilities Report adds a further layer of concern, noting that the true leverage in private credit may be closer to 7x debt-to-EBITDA once EBITDA adjustments and add-backs are stripped away, versus the reported 4.0x–5.0x range. For any operator relying on adjusted EBITDA to satisfy covenant compliance, the gap between reported and economic leverage is now a primary underwriting variable.
Sector Intelligence: Where Lenders Are Leaning In, and Where They Are Pulling Back
🔴 Software & Technology Services: Deeply Dislocated, Selectively Attractive
No sector has been more violently repriced than software and technology services. Secondary B-rated spreads in the software sector are running approximately 245 basis points wider than year-end 2025 levels and roughly 229 basis points above the broader B-rated loan index, per PitchBook LCD data as of June 19, 2026. The catalyst: accelerating AI disruption of traditional SaaS business models, compressing the disruption timeline from years to quarters. Software now represents approximately 20% of private market leveraged credit exposure versus roughly 13% in liquid leveraged loan markets, meaning private credit portfolios carry disproportionate AI disruption risk. Lenders are evaluating AI-impacted software borrowers on a case-by-case basis, with lower implied enterprise values driving materially higher loan-to-value ratios quarter-over-quarter. Paradoxically, the sell-off has created entry opportunities for disciplined lenders willing to do the work: as Wellington Management notes, “the gap between winners and losers has widened, and that is where value is being found.”
🟡 Healthcare: Non-Accrual Leader, Caution Required
Healthcare has led all sectors in loans placed on non-accrual status over the past year, per Morgan Stanley IM’s direct lending portfolio data. Despite the sector’s historically defensive reputation (driven by demographic tailwinds and non-cyclical service models) credit stress has concentrated in healthcare technology and services companies facing reimbursement compression and operational disruption. Institutional lenders including Morgan Stanley are maintaining a significant underweight to healthcare in new direct lending commitments. Lenders with legacy healthcare exposure from 2021–2022 vintages should actively stress-test FCCR at current rate levels and monitor covenant headroom.
🟢 Infrastructure & Digital Assets: The New Private Credit Frontier
The most significant structural growth story in private credit is the pivot toward asset-backed finance (ABF) and digital infrastructure lending. The AI buildout has created enormous financing demand for data centers, fiber networks, and power infrastructure, capital needs that traditional bank balance sheets cannot fully absorb and that public bond markets cannot always structure efficiently. Morgan Stanley estimates private credit could supply more than half of the $1.5 trillion needed for global data center buildouts through 2028. Private credit CLO issuance (a key channel for infrastructure and ABF) reached $17.3 billion through mid-June 2026, per PitchBook, pacing in line with 2025’s record. AAA tranches from Golub Capital and Blackstone’s BCRED platform priced at approximately 148 basis points over benchmark rates in May 2026, demonstrating firm investor demand for the structure.
🟡 Energy-Intensive Industrials: Underwriting Tightening
The Middle East conflict introduced decision-making paralysis across energy-intensive manufacturing and industrial sectors in Q1 2026, effectively stalling activity through March. Lenders have responded by tightening underwriting standards for businesses whose leverage was predicated on stable energy costs. Capstone Partners’ Q1 2026 Leveraged Finance Update notes that markets will continue to factor oil price movements into deals with heavy energy exposure over the coming quarters. Operators in these sectors should expect lenders to stress energy cost assumptions and require wider spread cushions on new facilities.
🟢 Core Middle Market (Non-Software): Lender Discipline, Improving Terms
Away from the AI-disrupted software segment and stressed healthcare names, the core middle market, companies with $10M–$100M in EBITDA, is exhibiting the most compelling lender-borrower dynamics in years. Deal value in middle market private equity increased approximately 10.7% year-over-year through Q2 2026, with exit activity rising 14% over the same period. These companies are large enough to have operating scale but generally lack liquid market alternatives, which means private lenders retain greater negotiating leverage on documentation, covenant packages, and OIDs. Lower middle market specialists such as those tracked by Cliffwater continue to deliver 100–200 basis points of yield premium over upper-middle-market direct lending with comparable or lower realized loss rates, due to reduced origination competition.
Implications for Institutional Investors and Operators
For Institutional Investors and Lenders
The mid-2026 environment is structurally favorable for scaled, disciplined private credit managers with institutional capital backing. The shift in supply/demand dynamics (elevated BDC redemption requests, more selective deployment among larger platforms, and rising M&A deal flow) has created the negotiating conditions that disciplined lenders require. New loans are increasingly coming with tighter documentation, fewer PIK concessions, and more conservative leverage, making today’s vintage potentially superior on a risk-adjusted basis to the 2022–2024 borrower-favorable window. However, the FSB’s transparency warnings are operationally significant: investors must scrutinize EBITDA add-back methodologies (caps are increasingly being imposed at 25–35% of consolidated EBITDA in well-structured deals), PIK income as a share of total interest income (any portfolio approaching 10% PIK is a leading indicator of deteriorating credit quality), and non-accrual rates on a fair-value basis versus cost basis.
The private credit CLO market, now at approximately $155 billion outstanding per the FSB, offers institutional investors a liquid route to senior-secured middle market exposure with transparent tranche pricing. For those seeking direct portfolio construction, the lower middle market (EBITDA below $30M) continues to offer the best risk-adjusted origination opportunities with the highest structural protections.
For Business Operators and Borrowers
The operational calculus for debt-financed operators has shifted materially. At a 3.50%–3.75% funds rate and unitranche spreads of SOFR + 475–550 bps, all-in floating rates on new private credit facilities range from approximately 8.5%–9.25%: placing severe pressure on fixed charge coverage ratios, particularly for companies with EBITDA growth trajectories below 10% annually. Operators must now stress-test their FCCR at current rates with zero rate relief through 2027. Lenders are increasingly requiring FCCR maintenance covenants of 1.10x–1.25x tested quarterly, versus the more relaxed incurrence-only structures that prevailed in 2023–2024. For companies planning dividend recapitalizations, a popular capital return mechanism in 2024–2025, the window is narrowing: wider spreads, heightened lender caution, and valuation uncertainty will make these transactions more expensive and structurally constrained through H2 2026.
The single most important operational action for borrowers is to proactively validate EBITDA add-back methodologies with lenders before covenants are tested, not after. The gap between sponsor-model EBITDA and lender-recognized EBITDA has become a primary source of friction and covenant breach risk in the current environment.
Forward-Looking View: H2 2026 and Into 2027
The next six months will be defined by dispersion. Broad index spreads mask a far more volatile picture underneath: sectors with AI exposure, legacy PIK structures, and 2021–2022 vintage overleveraging will see continued stress, while core middle market, infrastructure, and ABF credits should benefit from improving supply/demand dynamics and a recovering M&A pipeline. Moody’s baseline GDP forecast of approximately 1.5% growth places the economy just above the historical stall-speed threshold below which defaults accelerate: a signal that credit selection, not asset class exposure, will determine return outcomes.
On the regulatory front, the FSB’s May 2026 Vulnerabilities Report has put systemic risk from private credit’s bank interconnectedness squarely on regulators’ radar. The U.S. National Association of Insurance Commissioners is reviewing internal credit ratings for private credit holdings, and AIFMD II requirements in Europe are tightening leverage limits and liquidity reporting for private credit managers. These regulatory pressures, combined with the Trump administration’s 2025 executive order opening 401(k) plans to alternative assets, will reshape distribution channels: semi-liquid and evergreen vehicles are expected to account for approximately $1.4 trillion of private credit AUM by 2030, per Preqin, but the liquidity management discipline required to operate these vehicles in a higher-default environment has not yet been fully stress-tested.
For well-capitalized institutional investors with long-dated mandates and the ability to deploy through volatility, the second half of 2026 represents the best entry environment for disciplined direct lending since early 2023: wider spreads, tighter structures, improving documentation, and a clearing M&A pipeline. The competitive advantage will belong to managers who can combine origination depth, underwriting rigor, and the operational capacity to manage problem credits, not those who simply accumulated AUM during the borrower-friendly era.
Key Market Insights
- Spreads Have Reset, But Structure Is the Real Story: Middle market private credit spreads are 50–100 bps wider since late 2025 per PitchBook, but the more durable shift is structural: new loans carry less leverage, more covenants, fewer PIK concessions, and tighter documentation, making today’s originations potentially superior on a risk-adjusted basis to recent vintages.
- SLOOS Confirms Bank Tightening Across C&I and NDFI Lending: With net 8.1% of domestic banks tightening C&I standards for large/mid-market firms in Q2 2026 (FRED/Federal Reserve), the bank-to-private-credit substitution effect is structurally intact, creating sustained deal flow for private lenders even as some of the largest BDC platforms moderate deployment pace.
- FCCR Compression Is the Operator’s Critical Risk: EBITDA-to-interest coverage has fallen to approximately 3.1x in leveraged deals from 4.0x+ pre-rate-hike, and maintenance FCCR covenants are tightening to 1.10x–1.25x quarterly. Borrowers must stress-test coverage ratios at current rates with zero assumption of near-term relief.
- Software Is the Most Dislocated Sector, With Selective Opportunity: At 245 bps wider than year-end B-rated benchmarks, software sector credits are pricing in significant AI disruption fear. Lenders willing to conduct granular, bottom-up underwriting of AI-resilient software businesses (those with durable net revenue retention and non-replicable workflows) may find the current dislocation is pricing fear beyond fundamentals.
- True Leverage May Be Closer to 7x Than the Reported 4–5x: The FSB’s May 2026 Vulnerabilities Report flags that EBITDA adjustments and add-backs mean reported debt/EBITDA of 4–5x may mask true leverage of approximately 7x in private credit portfolios. Investors and operators must demand transparency on add-back caps, exclude projection-based synergies, and validate quality-of-earnings rigor before deployment or covenant reliance.


