
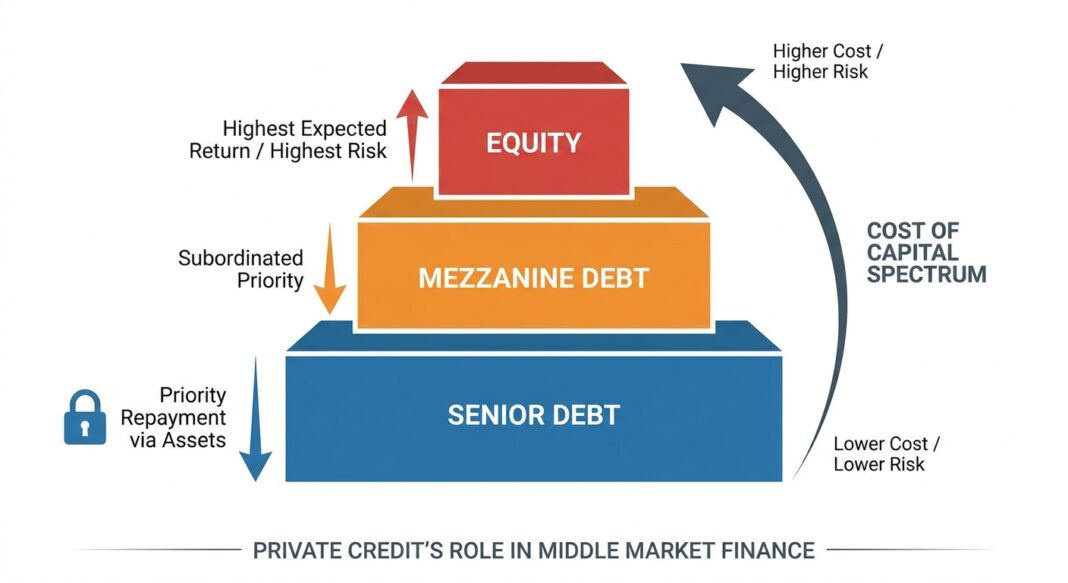
Why the Price of Capital Is Never Arbitrary
Every dollar a business borrows or accepts as equity carries a price. That price, the cost of capital: is not random. It reflects the precise position of that dollar in the repayment hierarchy, the amount of risk a lender or investor absorbs, and the protections they negotiate to guard against loss. Understanding how capital is priced across the spectrum from senior bank debt to private equity is one of the most foundational skills in corporate finance, and one of the most misunderstood by both first-time borrowers and newer investors.
Private credit occupies a critical and expanding middle zone in this spectrum. According to Cleary Gottlieb’s 2026 Outlook, the private credit market now extends well beyond senior loans to include junior lending, mezzanine financing, infrastructure debt, and asset-backed finance, giving both operators and investors a wider menu of options than ever before. To navigate that menu intelligently, you must first understand the mechanism that sets every price on it: risk as a function of position.
This article teaches that mechanism from the ground up, with real numbers and current market data.
The Concept: Capital Stack Position Determines Price
Imagine a company’s balance sheet as a building. The capital stack is the floor plan: each layer of financing occupies a specific floor, and in a default scenario, the residents on the lowest floors get paid first. Those on higher floors wait, and may receive nothing if the building’s value runs out before they are reached.
This repayment priority is called seniority, and it directly governs cost of capital. The mechanism is straightforward:
- Senior secured lenders sit at the base of the stack. They hold first-lien claims on company assets. Because they are first in line for repayment and hold collateral, they accept the lowest yield, their risk is lowest.
- Mezzanine or junior debt lenders sit above senior debt. They absorb losses before equity but after senior lenders are paid in full. They demand a higher yield to compensate for subordination.
- Preferred equity carries a contractual return preference over common equity, but ranks below all debt. Its required return is higher still.
- Common equity is the residual claimant, paid last, if at all. It carries the highest expected return requirement because it absorbs every dollar of loss first.
In private credit, Hamilton Lane explains that senior private credit offers the highest protections for investors and the lowest level of risk, while moving down the capital structure to more junior debt increases yields as protections decrease. That inverse relationship between protection and return is the foundational logic of every financing structure a CFO or investor will ever encounter.
How It Works: A Concrete $50M LBO Example
Consider a hypothetical middle-market manufacturing company purchased in a leveraged buyout at a $50 million enterprise value. The sponsor funds the acquisition across the capital stack as follows:
- Senior Secured Loan (First Lien): $25M: Price: SOFR + ~550 bps, all-in ~9.0–9.5%. This is the private credit direct lending layer. It is backed by a first-priority lien on all company assets. If the business fails and assets are liquidated at even 60 cents on the dollar ($30M), this lender is fully repaid.
- Mezzanine / Second Lien: $10M: Price: 13–15% (often structured as a fixed-rate cash coupon plus PIK). This lender is only repaid after the $25M senior loan is satisfied. At 60 cents on the dollar liquidation, there is only $5M left, meaning the mezzanine lender takes a partial loss. The premium compensates for that subordination risk.
- Equity: $15M: Required return: 20–25%+. The private equity sponsor funds the remainder. In a liquidation at 60 cents on the dollar, the equity receives nothing after the two debt layers consume the proceeds. The sponsor only profits if they grow the business’s value beyond $35M (the total debt load).
This is not theoretical. Blackstone’s Essentials of Private Credit describes how direct lending managers focus on being senior secured lenders to scaled businesses, structuring deals to maximize investor protection: precisely because the senior position in the capital stack provides a large equity buffer that would need to be entirely wiped out before the debt is impacted.
Current Market Reality: Where the Spectrum Sits in Mid-2026
The cost of capital spectrum is not static; it shifts with interest rates, credit spreads, and the competitive dynamics of the lending market. Here is where each layer sits today, grounded in recent data:
| Capital Layer | Approximate Cost (Mid-2026) | Source |
|---|---|---|
| Bank C&I Loan (large firms) | SOFR + ~200–350 bps / ~7–8% | Fed SLOOS, April 2026 |
| Direct Lending, Senior Secured (1L) | High single digits unlevered (~9–10%) | Northleaf Capital, Q1-2026 |
| CDLI Index Return (20-yr avg) | 9.5% average; 9.3% in 2025 | Cliffwater CDLI, March 2026 |
| Mezzanine / Junior Debt | 13–16% (cash + PIK) | Morgan Stanley, Private Credit Outlook |
| Private Equity (common equity) | 20–25%+ target IRR | Cleary Gottlieb, 2026 Outlook |
A critical dynamic is shaping the senior end of this spectrum right now: banks are tightening. The Federal Reserve’s April 2026 SLOOS reported that modest net shares of banks tightened standards on C&I loans to firms of all sizes during Q1 2026, with banks citing a less favorable economic outlook, industry-specific concerns, and reduced risk tolerance as key drivers. This withdrawal creates a structural opening for private credit lenders to fill.
Northleaf Capital’s Q1-2026 market update notes that periods of market volatility typically see banks and liquid credit markets retrench, with private equity sponsors turning to private credit for greater execution certainty, exactly the dynamic playing out today. Meanwhile, the CDLI benchmark, which tracks over 21,000 directly originated U.S. middle-market loans totaling $549 billion as of December 2025, delivered 9.3% total returns for 2025, with interest income of 10.4% as the primary driver, reflecting the income-generating power of the senior secured position.
Zooming out, the market itself reflects how capital has migrated away from banks. PIMCO and Preqin data show that North American direct lending AUM grew roughly sevenfold over the past decade, from $93 billion in 2015 to approximately $644 billion by year-end 2025. McKinsey’s 2026 Private Credit Report further highlights that direct lending is now the largest private credit sub-strategy at 52% of global private credit AUM per Morgan Stanley and PitchBook data, cementing its role as the dominant pricing reference point for middle-market senior debt.
Decision Framework: Applying the Spectrum
For Investors Evaluating Allocations
The cost of capital spectrum is essentially a risk-return map. Investors consider which position offers the right combination of yield, protection, and liquidity for their portfolio goals:
- Prioritize capital preservation? Senior secured direct lending provides first-lien priority, floating-rate income, and historically low loss rates. The CDLI has recorded only one negative return year in two decades of data.
- Seeking higher absolute returns? Mezzanine and junior capital strategies offer 13–16% targets, but investors accept subordinated repayment priority and higher potential loss severity. These instruments often include equity kickers or warrants to augment returns.
- Evaluating manager selection? With direct lending now a mature market, the top 25 managers accounted for approximately 72% of total closed-end fundraising in 2025 per McKinsey and Preqin, the quality of underwriting and relationship depth matter more than ever in distinguishing outcomes across managers at similar points in the stack.
For Operators Accessing Capital
Business owners and CFOs use the spectrum to minimize cost while preserving control and operational flexibility:
- Use the cheapest compatible layer first. If a company qualifies for bank financing, that is structurally the lowest-cost option. Private credit direct lending is the next step when bank terms are unavailable, too restrictive, or too slow, a condition increasingly common given current SLOOS tightening trends.
- Avoid unnecessary equity dilution. Selling equity at a 20–25% IRR hurdle is far more expensive than borrowing at 9–10%, the math is unambiguous. Operators benefit from understanding the full spectrum and using as much debt as is prudently serviceable before turning to equity.
- Consider speed and certainty. Cleary Gottlieb’s 2026 Outlook notes that CFOs and treasurers increasingly recognize that private credit offers advantages including speed, flexibility, and confidentiality: factors with real economic value in time-sensitive transactions like acquisitions or recapitalizations.
Key Takeaways
- Position drives price. Every layer of the capital stack carries a cost that reflects its subordination level. Senior secured debt is cheapest; common equity is most expensive. This is not negotiable; it is the fundamental logic of risk pricing.
- Private credit fills the gap between banks and equity. As bank standards tighten, confirmed by multiple consecutive SLOOS surveys through Q1 2026, private direct lenders step in as the reliable middle tier of the cost-of-capital spectrum for middle-market borrowers.
- The CDLI benchmark anchors senior credit pricing. With a 20-year average return of 9.5% and 2025 interest income of 10.4%, the Cliffwater Direct Lending Index provides the clearest available picture of what first-lien private credit yields in practice.
- Dilution math favors debt. Operators who treat all capital as equivalent miss one of the most important levers in corporate finance. Replacing a 22% equity IRR hurdle with 9–10% senior debt on even a portion of the capital stack creates substantial long-term value for existing shareholders.
- Market maturation is reshaping the spectrum. Direct lending has migrated upmarket, Blue Owl’s 2026 analysis notes that over $58 billion of $1 billion+ direct lending deals were completed in the first three quarters of 2025 alone. The spectrum is no longer just a middle-market tool; it now operates at every scale of corporate finance.


