
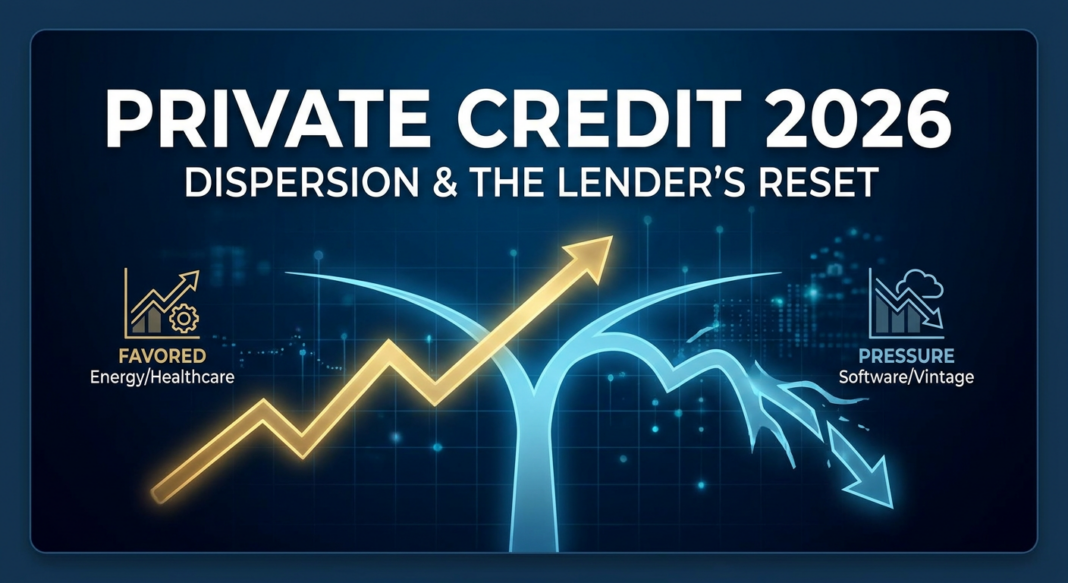
Market Headline: A Lender-Friendly Reset Takes Hold, But Dispersion Is the New Risk
As of July 11, 2026, the U.S. private credit market is navigating the most consequential reset since the post-GFC era. After years of spread compression, loosening documentation, and borrower-friendly structures, the pendulum has decisively swung back toward disciplined lenders. Geopolitical shock, the U.S. military strike on Iran and subsequent energy price volatility, compounded an already volatile first quarter marked by an AI-driven rout in software and technology credit, triggering a broad repricing across leveraged finance. The net effect: spreads are 50–100 basis points wider than late-2025 levels, covenants are tightening, and capital has become materially more selective.
But this is not a uniform market. The headline story obscures a profound bifurcation. Senior, first-lien lending to high-quality, non-cyclical borrowers remains competitive and well-bid. Meanwhile, software-exposed credits, 2021–2022 vintage loans, and sub-single-B rated borrowers face widening premiums of 200–250 basis points above historical norms, rising non-accruals, and structurally impaired interest coverage. According to Lord Abbett’s 2026 Midyear Outlook, the second half of 2026 is likely to be defined by dispersion: with outcomes increasingly driven by where managers are lending, how loans are structured, and how much free cash flow borrowers generate. For institutional investors and operators, the implications are direct: the cost and availability of credit are now deeply sector-specific, vintage-dependent, and underwriter-sensitive.
Quantitative Market Snapshot
The following data box synthesizes the most current available metrics across public and private credit markets as of Q2 2026.
| Metric | Current Value (Q2 2026) | Prior Period (Q4 2025 / Q1 2026) | Direction | Source |
|---|---|---|---|---|
| Middle Market Private Credit Spreads (Unitranche) | SOFR + 475–550 bps | SOFR + 450–525 bps (YE 2025) | ↑ ~25 bps wider | VRC Q2 2026 |
| Software / Tech Sector Secondary Spreads | ~245 bps wider than YE 2025; ~229 bps above B-rated loan index | At or near B-rated loan index (YE 2025) | ↑ Significant widening | VRC / PitchBook LCD, June 2026 |
| Direct Lending Deal Volume (Q2 2026, through June 22) | $29.2B across 138 transactions | $74.1B across 217 deals (Q1 2026) | ↓ ~61% decline vs. Q1 | PitchBook LCD, Q2 2026 |
| Fed SLOOS, C&I Lending Standards (Large/Mid-Market Firms) | Net +8.1% tightening (Q2 2026); Large banks: +10.0% | Tighter Q1 2026; all firm sizes | ↑ Continued tightening | Federal Reserve SLOOS / FRED, May 2026 |
| Private Credit vs. High Yield Spread Premium | ~150–200 bps over comparable HY (compressed from ~350 bps in 2019) | ~300 bps (early 2026 estimates) | ↓ Long-run compression | Owners.pe, April 2026 |
| BDC Non-Accrual Rate (Median, Q1 2026) | 1.4% (at amortized cost) | <1.4% (prior quarters) | ↑ Rising; concentrated in smaller borrowers | Heron Finance / SEC Filings, Q2 2026 |
| Private Credit Default Rate (Fitch PMR Portfolio) | 9.4% (January 2026, Fitch Privately Monitored Ratings); 1.6%–4.7% (broader market estimate, 2025) | 9.2% (full year 2025); 8.1% (2024) | ↑ Rising; heavily size-dependent | Fitch / Cliffwater, May 2026 |
| 3-Month Term SOFR (June 2026) | 3.68% | ~3.67% (March 2026); ~3.18% (December 2025) | ↑ Higher-for-longer trajectory | VRC Q2 2026 |
| 5-Year U.S. Treasury Yield (June 2026) | 4.23% | 3.92% (March 2026) | ↑ +31 bps QoQ | VRC Q2 2026 |
| Middle Market FCCR / Interest Coverage (EBITDA/Interest) | ~1.7x–1.8x average; marginally improved YoY | 1.04x (stressed cohort, Q1 2023 at 5%+ SOFR); recovering since | ↑ Modest improvement from rate cycle trough | Columbia Threadneedle / Lincoln Intl., 2026 |
| Debt-to-EBITDA (S&P Estimates, Elevated Sectors) | 7.5x–8.0x (some sectors, excluding addbacks) | Similar; concern persists at upper ranges | → Elevated, structurally sticky | S&P via Columbia Threadneedle, 2026 |
| Private Credit CLO Issuance (YTD through mid-June 2026) | $17.3B | Similar pace to H1 2025 | → Resilient amid volatility | PitchBook via Benzinga, July 2026 |
Note: All data sourced from third-party institutional reports and regulatory filings. Metrics subject to revision. Not investment advice.
Sector Analysis: Appetite, Aversion, and Structural Shifts
🔴 Under Pressure: Software & Technology Services
Software remains the defining stress point in 2026. Per VRC and PitchBook LCD data through June 19, 2026, software secondary spreads are approximately 245 basis points wider than year-end 2025 levels and roughly 229 basis points above the broader B-rated loan index. The catalyst: the release of Anthropic’s Claude Cowork product earlier in the year fueled a global re-rating of software-as-a-service (SaaS) business models, raising structural questions about subscription revenue durability that lenders had previously taken for granted. Private credit’s estimated 20% exposure to software, versus ~13% in the liquid leveraged loan market, amplified the impact. Lenders are now evaluating AI-impacted borrowers on a strictly case-by-case basis, and transactions that require software concentration are pricing at 75–100 basis points above year-end levels per VRC’s standard spread matrix.
🟢 Favored: Healthcare & Non-Cyclical Services
According to Octus Data, healthcare led all sectors in private credit deal activity in 2025, accounting for 19% of all direct lending transactions, with spreads averaging approximately SOFR+500 bps in Q4. Demographic tailwinds, recurring revenue models, and a historically non-cyclical cash flow profile continue to attract lender appetite, though Morgan Stanley’s private credit team notes that healthcare has also led all sectors in loans placed on non-accrual status over the past year, reflecting operational complexity in certain healthcare sub-verticals. The divergence underscores that even “favored” sectors demand rigorous sub-sector diligence.
🟢 Structural Opportunity: Energy & Digital Infrastructure
Paul Weiss identifies energy infrastructure, digital infrastructure, defense and national security, and next-generation manufacturing as priority sectors for institutional private credit capital in 2026. BlackRock’s 2026 private markets outlook designates asset-based financing as an area where it expects a “profound increase in opportunities,” driven by the energy transition, data center buildout for AI compute, and infrastructure capital needs that traditional banks are structurally unable or unwilling to meet. Private credit premiums of 100–300 basis points above comparable bank financing are increasingly being characterized not as temporary but as the new structural cost of non-bank capital in these sectors.
🔴 Caution: 2021–2022 Vintage Loans & Sub-B Credits
VRC’s Q2 2026 Private Markets report identifies 2021–2022 vintages and software-related exposures as the primary stress concentrations in the current market. Octus data shows that below single-B rated credit spreads have widened by 200–250 basis points relative to historical observations. The root cause is structural: loans originated at near-zero rates with high leverage multiples (7.5x–8.0x debt-to-EBITDA in some cases) are now servicing floating-rate debt at 3.68% SOFR. For borrowers with EBITDA under $25 million, Fitch recorded a 15.8% default rate in 2025: nearly four times the 4.0% rate for borrowers with EBITDA above $100 million.
Regulatory Shift: Leveraged Lending Guidance Rescinded
A material structural development occurred on December 5, 2025, when the OCC and FDIC jointly rescinded the 2013 Interagency Guidance on Leveraged Lending. Private credit lenders now have greater flexibility to determine their own risk appetite and to develop institution-specific definitions of leveraged loans. The medium-term implication: more competitive mandates could emerge in the deeper leverage segments previously constrained by supervisory guidance, though this deregulatory signal arrives precisely as the market is learning the consequences of prior looseness. Separately, the April 2026 SLOOS revealed that banks have tightened standards for all categories of non-depository financial institution (NDFI) loans, including to private equity funds, a signal that bank funding to the private credit ecosystem itself is facing headwinds.
Implications for Investors and Operators
For Borrowers / Operators
- Cost-of-capital recalibration is mandatory. As Environment+Energy Leader reports, CFOs planning infrastructure financings in 2026 should build in private credit premiums of 100–300 basis points above bank financing baselines. Project hurdle rates set under prior rate assumptions need immediate revision.
- FCCR and interest coverage are under the microscope. With middle-market interest coverage averaging 1.7x–1.8x, lenders are scrutinizing the cushion between EBITDA and fixed charges at granular levels. Borrowers with coverage ratios approaching 1.25x or below should expect covenant tightening, higher pricing, or conditionality on draws.
- Vintage and sector positioning matter more than ever. 2021–2022 leveraged buyout borrowers facing refinancing in 2026 are encountering a fundamentally different market: spreads 50–100 bps wider, less covenant flexibility, and lenders unwilling to underwrite prior leverage levels. North American M&A volumes are 52.3% below January 2026 levels, limiting exit options and increasing refinancing pressure.
For Institutional Lenders / Investors
- This is a lender’s market, but only for disciplined, selective capital. Lord Abbett’s midyear view is explicit: more transactions to finance, less competing capital, and greater ability to negotiate price and structure. Managers with dry powder and established sponsor relationships are in the strongest position since 2022.
- Redemption pressure is structural, not cyclical. PitchBook LCD data shows redemption requests exceeded the 5% quarterly cap at 10 of 16 monitored BDCs in Q2 2026, with Apollo Debt Solutions receiving requests for 17% of outstanding shares. Redemption caps are functioning as designed, but liquidity management is now a critical operational variable, not a footnote.
- Private credit yield advantage over high yield has narrowed. The illiquidity premium over comparable high-yield bonds has compressed from approximately 350 bps in 2019 to roughly 150–200 bps today, per Owners.pe analysis. Investors must weigh whether this premium adequately compensates for illiquidity, valuation opacity, and concentration risk, particularly as investment-grade corporate spreads offer a yield-to-worst of 5.16% in a more liquid wrapper.
- Regulatory scrutiny is intensifying globally. PwC’s 2026 Global Private Credit Survey flags the Financial Stability Board as actively scrutinizing risks from the asset class, with a report due later in 2026. The NAIC is reviewing internal credit ratings used by insurers to achieve lower capital charges. EU managers face AIFMD II leverage limits and enhanced governance requirements. This regulatory tide will increase compliance costs and potentially compress returns at the margin for less-capitalized platforms.
Forward-Looking View: H2 2026 and Beyond
The confluence of higher-for-longer rates, geopolitical uncertainty, and AI-driven sector disruption is reshaping private credit from a broadly accessible asset class into a precision instrument. Moody’s baseline GDP forecast of ~1.5% for 2026 places the economy just above historical “stall speed”, the level below which defaults historically accelerate. This is a narrow margin with meaningful tail risk.
The structural opportunity, however, is real. Morgan Stanley’s private credit team expects a large refinancing wave and new deal demand to gradually overtake private credit supply, creating pricing power for disciplined lenders. Middle market PE deal value has already increased approximately 10.7% year-over-year, and exit activity has risen 14%, suggesting a gradual normalization in transaction activity, albeit from a compressed base.
For H2 2026, three forces will define outcomes: (1) whether the Iran conflict stabilizes, allowing energy prices to normalize and reducing the higher-for-longer rate premium; (2) whether software and AI sector concerns are resolved through earnings confirmation or further disruption; and (3) whether the $450–550 billion in private credit dry powder is deployed selectively or competitively. Lord Abbett’s conclusion resonates: the opportunity is real, but the advantage will accrue to managers who combine patience with discipline.
Key Market Insights for Bond Capital Clients
- ● Spreads have widened 50–100 bps since late 2025, with unitranche pricing ranging SOFR+475–550 bps in the core middle market. This is a lender-favorable setup for new origination, but existing portfolio marks will face pressure, particularly in software-heavy funds.
- ● Direct lending volumes collapsed 61% from Q1 to Q2 2026 ($74.1B to $29.2B), driven by geopolitical shock and AI disruption. The deal pipeline is rebuilding, but selectivity, not volume, defines Q3 strategy.
- ● Fixed charge coverage ratios average 1.7x–1.8x for middle-market borrowers, improved from the 1.04x trough but still thin. Operators with FCCR below 1.25x should proactively engage lenders before covenant triggers materialize.
- ● Bank lending standards continue to tighten: the Fed SLOOS reports a net 8.1% tightening on C&I loans to large and mid-market firms and 10.0% among large banks specifically. Banks are also tightening standards on NDFI loans, a second-order tightening for private credit platforms reliant on bank warehouse facilities.
- ● Sector bifurcation is the defining credit theme of 2026: energy infrastructure, digital infrastructure, and non-cyclical services offer spread premium and structural lender protections; software-exposed 2021–2022 vintage credits face a materially higher cost of capital, shrinking exit windows, and increasingly active liability management discussions.


