
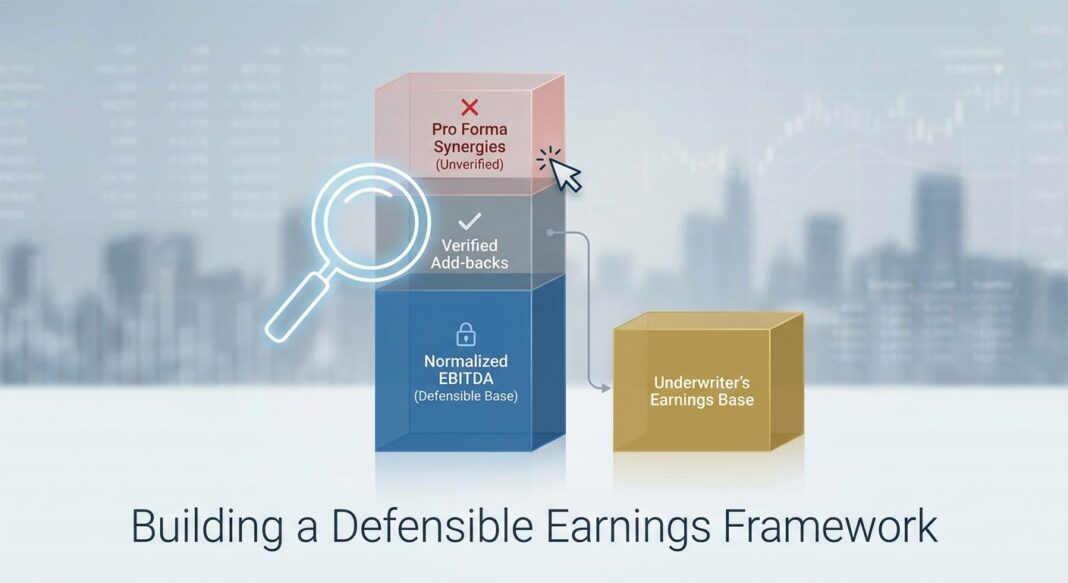
The Underwriting Challenge: When the Earnings Number Isn’t the Earnings Number
Every credit underwriter eventually confronts the same problem: the EBITDA figure in the Confidential Information Memorandum is not the EBITDA figure the business actually earns. The gap between reported earnings and a lender’s defensible, underwritable earnings base can be the difference between a performing loan and a restructuring. In today’s private credit environment, that gap has become systemic.
The Financial Stability Board’s May 2026 report on private credit vulnerabilities found that aggressive EBITDA adjustments have caused reported leverage to be materially understated, with the typical true leverage in private credit likely closer to 7x debt-to-EBITDA, well above what loan documentation formally reflects. Meanwhile, McKinsey’s 2025 Global Private Markets Report found that new-issue leverage ratios averaged 4.9x EBITDA in 2025, a figure that almost certainly understates economic leverage due to the proliferation of pro forma add-backs, synergy credits, and run-rate adjustments embedded in EBITDA definitions.
The consequence is playing out in real time. Fitch Ratings reported in May 2026 that the U.S. private credit default rate hit a record high of 6.0% in April, and the IMF’s 2025 Financial Stability Report found that approximately 40% of private credit borrowers have negative free cash flow, up from 25% in 2021. For underwriters, the lesson is direct: the quality of the earnings base you accept at origination determines the credit quality of the loan you hold for the next five to seven years.
This article teaches the full analytical framework for EBITDA adjustments and normalization: the methodology, the calculations, the red flags, and the institutional standards that separate disciplined underwriters from lenders who price risk they cannot see.
The Framework: From Reported EBITDA to Lender-Underwritable EBITDA
Normalized EBITDA is not the same as adjusted EBITDA, and the distinction matters enormously in credit underwriting. Adjusted EBITDA is typically management’s first-pass add-back schedule, the highest number a seller or borrower believes they can defend. Normalized EBITDA is the earnings figure that survives independent diligence: the sustainable, recurring operating cash flow a lender can actually rely on to size debt capacity, set covenant thresholds, and model debt service coverage.
The formal definition is precise: normalized EBITDA starts with reported EBITDA, removes non-recurring, non-operating, and owner-specific items, and then adjusts for supportable run-rate effects that a buyer or lender can reasonably rely on. In M&A and lending, normalized EBITDA matters because valuation multiples, debt capacity, and post-LOI diligence all depend on whether the earnings figure is credible, repeatable, and supported by evidence.
The normalization process follows a consistent sequence:
- Start with Reported EBITDA: Begin with net income and add back interest, income taxes, depreciation, and amortization (the trailing twelve-month or weighted-average period).
- Owner Compensation Adjustment: Compare actual owner draw, salary, and benefits to a market-rate replacement manager. Add back the excess with W-2 and compensation survey support. Critically, if the owner is underpaid, a lender must normalize downward to account for the market-rate cost of replacement management.
- Personal Expense Add-backs: Identify owner personal costs run through the business (personal vehicles, family health insurance, personal travel, above-market family payroll) and add them back with receipt-level documentation.
- One-Time and Non-Recurring Items: Remove one-time revenue (e.g., PPP loan forgiveness, single-year government grants). Add back one-time costs (e.g., legal settlements, extraordinary repairs) that do not represent run-rate operations.
- Rent and Related-Party Normalization: If the borrower pays below-market rent to a related entity, normalize to market rate as an expense increase, reducing EBITDA. This is the most frequently missed downward adjustment.
- Pro Forma Run-Rate Adjustments: Credit only for revenue and cost effects that are already contracted, implemented, and verifiable, not for projections or synergies that require future execution.
The standard for every adjustment is the same: traceability and reasonableness. Can the adjustment be traced to records? Is the rationale clear? Would the cost truly disappear or change under new ownership? Is the adjustment consistent with how the business will operate after closing?
Working Example: A $10M EBITDA Manufacturing Company
Consider a middle-market manufacturer with $52M in revenue and $10.8M in reported EBITDA. Management presents an adjusted EBITDA schedule of $12.4M, reflecting $1.6M in add-backs. A disciplined lender’s normalization process produces a materially different result:
| Line Item | Amount ($000s) | Lender Treatment |
|---|---|---|
| Reported EBITDA | $10,800 | Starting point |
| + Owner excess compensation add-back | +$420 | Accepted with W-2 + survey support |
| + One-time legal settlement add-back | +$180 | Accepted with court documentation |
| + Management-proposed synergy credit | $1,000 | Rejected: not yet contracted |
| − Below-market related-party rent normalization | −$300 | Downward adjustment to market rate |
| − Underfunded maintenance capex normalization | −$250 | Identified in facility inspection |
| Lender-Normalized EBITDA | $10,850 | vs. Management’s $12,400 |
The $1,550K gap between management’s adjusted EBITDA and the lender’s normalized EBITDA, at a 5.0x leverage multiple, represents $7.75M less in warranted debt capacity. Every rejected add-back compounds through the leverage calculation.
The Analysis: Calculating Leverage, Coverage, and Identifying Structural Issues
Once a defensible normalized EBITDA is established, the underwriter builds the full credit metrics suite. Three ratios form the core of the credit decision:
1. Total Leverage Ratio (Debt / Normalized EBITDA)
Using the example above ($45M in total debt against $10,850K in normalized EBITDA) the leverage ratio is 4.15x. At the borrower’s proposed $12.4M EBITDA, leverage would appear to be 3.63x, a full half-turn lower. For a lender with a 4.5x maximum leverage policy, the difference between accepting and rejecting management’s adjustments is the difference between a pass and a fail on the credit screen.
The Financial Stability Board noted that aggressive EBITDA add-backs are causing reported leverage to be systematically understated across the private credit market, with true economic leverage likely closer to 7x in many transactions, a figure that dramatically changes risk-adjusted return calculations.
2. Debt Service Coverage Ratio (DSCR)
DSCR = Normalized EBITDA ÷ (Annual Debt Service: Interest + Scheduled Principal). Lenders typically require a minimum 1.20x DSCR at origination, with covenant maintenance at 1.10x. Overly aggressive EBITDA normalization causes DSCR to appear acceptable on paper but fail during independent underwriting review, one of the most common reasons credit deals collapse at the financing stage.
At $10,850K EBITDA and $4.2M in annual debt service (blended interest at ~7.5% on $45M plus 2% amortization), DSCR is approximately 2.58x: comfortable. But stress the revenue by 15% (reflecting a moderate demand contraction), and normalized EBITDA contracts to ~$9,200K, pushing DSCR to 2.19x. A 30% revenue stress, not extreme in a cyclical manufacturing business, compresses EBITDA to ~$7,600K and DSCR to 1.81x. Understanding the cushion between current coverage and covenant-trigger levels is the core output of stress testing.
3. Quality of Earnings (QoE) Ratio
The QoE ratio is calculated as: Net Cash from Operating Activities ÷ Net Income. A ratio below 0.85x signals that reported earnings are not being converted into cash: a potential indicator of aggressive revenue recognition, delayed expense reporting, or unsustainable working capital dynamics. A company reporting high net income but negative operating cash flow warrants immediate scrutiny of accrual-basis accounting practices.
A QoE report formally evaluates revenue recognition, customer concentration, revenue quality, gross margin trends, add-back support, reserves, accounting cutoffs, working-capital behavior, cash conversion, and the relationship between EBITDA and free cash flow. The purpose is not just to verify arithmetic; it is to determine whether the earnings base used in valuation is accurate, repeatable, and financeable.
Industry Standards: What Institutional Lenders Require in 2026
The current private credit environment has materially tightened institutional underwriting standards around EBITDA normalization. Several data points define the current landscape:
📊 Data Box: Private Credit Default & Stress Metrics (2025–2026)
- 6.0%: U.S. private credit default rate as of April 2026, a record high (Fitch Ratings, May 2026)
- 65%: Share of 2025 corporate defaults that were distressed exchanges or restructurings, not hard defaults (Moody’s Ratings, 2025)
- 1.6%–4.7%: Range of estimated private credit direct lending default rate for 2025, depending on whether distressed exchanges are included (Moody’s, April 2026)
- 2.73%: Default rate in Proskauer’s Private Credit Default Index (697 loans, $189.2B) in Q1 2026, up from 1.84% just two quarters earlier (Forbes / Proskauer, May 2026)
- 40%: Share of private credit borrowers with negative free cash flow as of 2025, up from 25% in 2021 (IMF Global Financial Stability Report, 2025)
- 4.9x: New-issue median leverage ratio in private credit in 2025 per loan documentation (McKinsey Global Private Markets Report, 2026 / Kroll StepStone)
- ~7x: Estimated true economic leverage when aggressive EBITDA add-backs are unwound (Financial Stability Board, May 2026)
- 21%: Share of direct lending deals that were covenant-lite in 2025, up from 4% in 2023 (McKinsey, citing industry data)
Common Mistakes and Red Flags
Experienced lenders have developed a consistent list of add-back categories that warrant heightened scrutiny or outright rejection:
- Forward-looking synergy credits without a track record: Sellers and sponsors sometimes add back the projected EBITDA of a planned acquisition or new product line that has not yet been completed. Institutional buyers give zero credit for pro-forma add-ons without a verifiable history.
- Recurring costs reclassified as one-time: The clearest manipulation signal is an expense that appears in two or more consecutive years being labeled non-recurring. Buyers reject adjustments that attempt to relabel normal operating costs as exceptional.
- Missing downward adjustments: A credible adjusted EBITDA schedule includes both add-backs and add-downs. If the seller owns the real estate and charges below-market rent, or if key management is systematically underpaid, a lender must normalize those costs upward, reducing EBITDA even when management’s schedule shows only addbacks.
- PIK income masking cash flow stress: Payment-in-kind income at BDCs has risen sharply; public BDCs now receive an average of 8% of investment income via PIK. PIK income capitalizes interest rather than paying it in cash, masking deteriorating borrower liquidity. PIK usage is positively correlated with borrower stress in S&P’s private credit research.
- EBITDA positive but cash flow negative: One of the most revealing stress questions institutional LPs now ask is: how many portfolio companies report positive EBITDA but generate negative operating cash flow? A QoE ratio below 0.85x should trigger a mandatory deep-dive into working capital management and revenue recognition practices.
- Uncapped run-rate adjustments, Because expansive add-backs can materially affect leverage outcomes, institutional lenders typically impose percentage-of-EBITDA caps on projection-based or non-recurring adjustments, time-based restrictions, and verification requirements. Loan agreements that permit unlimited run-rate credits create structural leverage inflation that erodes covenant protection over time.
The macro backdrop reinforces the urgency of these disciplines. An environment of elevated rates and selective credit has triggered a shift toward more disciplined investor behaviors. LP scrutiny of underlying portfolio EBITDA has intensified, and lenders who relied on documentation flexibility rather than earnings discipline during the 2021–2023 vintage are now managing the consequences.
Underwriting Checklist: EBITDA Normalization Diligence
A disciplined lender’s EBITDA normalization process follows this sequence before any credit decision is made:
✅ Pre-Commitment Normalization Checklist
Step 1, Obtain Source Financials
- Collect 3 years of audited or reviewed financial statements plus trailing twelve-month (TTM) management accounts
- Request detailed general ledger (GL) trial balance, not just summarized P&L
- Obtain the borrower’s own add-back schedule with line-item support for each adjustment
Step 2, Commission Independent QoE
- Engage an independent accounting firm, do not rely solely on a seller-commissioned QoE for final credit sizing
- Require the QoE to address: revenue recognition, customer concentration, gross margin trends, working capital normalization, and cash conversion analysis
- Calculate the QoE ratio (Operating Cash Flow ÷ Net Income) and investigate any reading below 0.85x
Step 3, Test Every Add-back
- For each proposed adjustment, apply the traceability test: Can it be traced to documentation? Is the rationale clear and specific?
- Verify that one-time items do not recur in prior periods (cross-check 3-year history)
- Confirm all owner compensation adjustments are benchmarked to verifiable market compensation surveys
- Identify and quantify all missing downward adjustments (below-market rent, underpaid management, deferred maintenance)
- Reject all pro forma synergy credits unless the savings are already contracted and reflected in current-period actuals
Step 4, Stress Test the Normalized Base
- Model a base, moderate stress (−15% revenue), and severe stress (−30% revenue) scenario against normalized EBITDA
- Calculate DSCR at each scenario and identify the revenue decline at which DSCR breaches 1.20x and 1.10x
- Flag all credits where the cushion to covenant breach is less than 10% EBITDA decline
Step 5, Document the Earnings Bridge
- Prepare a formal Reported EBITDA → Lender-Normalized EBITDA bridge with accepted and rejected adjustments clearly annotated
- Include this bridge in the credit memorandum as the authoritative EBITDA basis for all leverage and coverage calculations
- Establish covenant EBITDA definition in the credit agreement with explicit caps on run-rate and synergy add-backs, time-based sunset provisions, and lender verification rights
Key Takeaways for Credit Underwriters
- 📌 Management’s adjusted EBITDA is a starting point, never a conclusion. Independent normalization (including downward adjustments for below-market rent, underpaid management, and deferred capital) routinely produces a meaningfully lower underwritable earnings base.
- 📌 True economic leverage is systematically higher than reported leverage. The FSB estimates that aggressive EBITDA add-backs have pushed true private credit leverage to approximately 7x in many transactions, nearly 2 turns above what loan documentation reflects at a 4.9x median reported level.
- 📌 The QoE ratio is a cash quality alarm. Operating Cash Flow ÷ Net Income below 0.85x signals that earnings are not converting to cash and demands a deep-dive into revenue recognition, working capital management, and accrual accounting practices before credit approval.
- 📌 Rising PIK income and negative free cash flow are structural warning signs. With 40% of private credit borrowers generating negative free cash flow and PIK income at BDCs averaging 8% of investment income, underwriters must look through headline EBITDA to cash conversion and liquidity at the borrower level.
- 📌 Covenant EBITDA definitions are credit documents, not boilerplate. Every percentage-of-EBITDA cap on run-rate add-backs, every time-based sunset provision, and every lender verification right in the credit agreement is a structural protection against the earnings inflation that is driving the current cycle of distressed restructurings and shadow defaults.


