
The Underwriting Challenge: When the Number on the Page Isn’t the Number That Matters
Picture a mid-market manufacturer presenting a confidential information memorandum with $12.3M in adjusted EBITDA on a trailing twelve-month basis. Reported EBITDA on the income statement? $9.8M. The $2.5M bridge is a tidy column of add-backs: a one-time legal settlement, owner salary normalization, a plant relocation expense, accelerated COVID-era inventory write-downs, and a line item labeled simply “management adjustments.”
This scenario is not unusual. In today’s deal environment, the distance between reported and adjusted EBITDA has become the single most contested terrain in credit underwriting. Buyers and lenders are scrutinizing these bridges with unprecedented rigor, and for good reason. As noted by advisory professionals tracking current deal conditions, every dollar of inflated or unjustified adjusted EBITDA has a disproportionate impact on valuation and deal returns. At a 5.0x leverage multiple, a $500K unsupported add-back inflates enterprise value by $2.5M and, more critically, understates true leverage by a full half-turn.
The underwriter’s core discipline is not to be the borrower’s advocate or adversary. It is to produce a lender-defensible earnings base: one that withstands a credit committee, survives the hold period, and still covers debt service if EBITDA contracts 15–20% from underwriting.
The Analytical Framework: A Three-Layer Earnings Audit
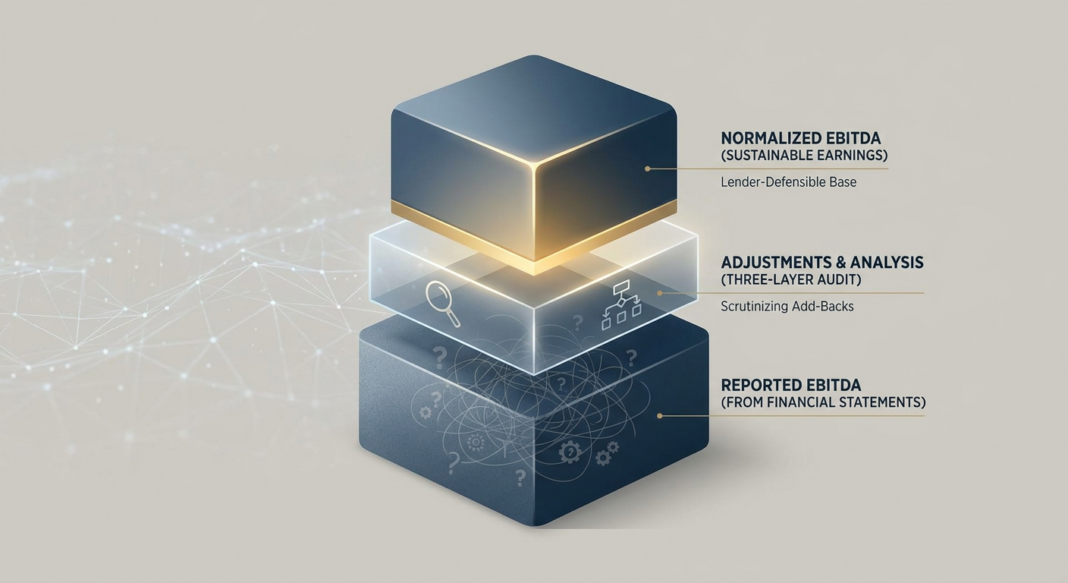
Experienced institutional lenders approach EBITDA normalization as a three-layer audit, not a negotiation. Each layer has a distinct purpose and methodology:
Layer 1: Reconstruct Reported EBITDA From Scratch
Never start from management’s adjusted EBITDA. Start from audited or reviewed financial statements. Build EBITDA bottom-up: Net Income + Interest Expense + Income Tax Provision + Depreciation & Amortization. Tie every line item to source documents: bank statements, GL exports, tax returns, and payroll records for LTM periods. As one practitioner framework describes it: seller-provided schedules are a starting point, not a conclusion.
For a $10M EBITDA manufacturing company, this reconstruction might look like:
| Line Item | Amount ($000s) |
|---|---|
| Reported Net Income (Tax Return) | $3,200 |
| + Interest Expense | $1,100 |
| + Tax Provision | $900 |
| + Depreciation & Amortization | $1,600 |
| = Reported EBITDA | $6,800 |
Layer 2: Evaluate and Classify Each Add-Back
Every proposed adjustment must be classified into one of three buckets: (A) Fully Creditable: documented, non-recurring, will not repeat; (B) Partially Creditable: recurring risk, requires haircut or cap; or (C) Rejected: unsubstantiated, recurring in nature, or represents a structural operating cost.
As Sidley Austin’s 2026 analysis of private credit agreements confirms, common add-backs that are more highly negotiated include restructuring and integration costs, transaction expenses, extraordinary or nonrecurring losses, pro forma synergies, run-rate adjustments, and company- or industry-specific items. Adjustments identified in sponsor models or quality of earnings reports are frequently incorporated, but institutional lenders then independently stress each one.
Critically, add-backs do not run only in one direction. Buyers and lenders must also make downward adjustments: sub-market owner compensation that must be replaced, related-party rents below market, deferred maintenance capex that will be recurring under new ownership, or understaffed management layers in founder-led businesses.
Layer 3: Build a Lender-Underwritten Normalized EBITDA
The lender’s normalized EBITDA represents the sustainable, repeatable operating cash flow the business can generate under arm’s-length ownership, with appropriate replacement costs for any owner-specific expenses removed, and without credit for future synergies or unproven run-rate improvements. The standard, as practitioners describe it, is traceability and reasonableness: Can each adjustment be traced to records? Is the rationale clear? Would the cost truly disappear or change under new ownership?
Walking Through the Calculations: The $10M EBITDA Manufacturing Case
Continuing the example above, management presents a $3.2M add-back schedule. The underwriting team works through each item:
| Proposed Add-Back | Mgmt Claim ($000s) | Lender Credit ($000s) | Rationale |
|---|---|---|---|
| One-time legal settlement | $800 | $800 | Fully documented; 100% creditable |
| Owner excess compensation | $700 | $400 | Haircutted: replacement CEO salary benchmarked at $300K vs. $1M paid |
| Plant relocation (one-time) | $600 | $600 | Documented invoices; non-recurring |
| Pro forma synergies (IT consolidation) | $700 | $0 | Not yet realized; no track record, rejected |
| “Management adjustments” (unspecified) | $400 | $0 | Vague, undocumented, rejected |
| Below-market related-party rent (downward) | – | ($200) | Rent paid to owner entity at 40% below market; lender adds back cost |
| Lender-Normalized EBITDA | $10,000 | $8,400 | $1.6M variance from management case |
The $1.6M haircut is not trivial. At a 5.0x leverage multiple, it represents $8M in enterprise value. It also changes the leverage calculation materially: if the deal is structured with $50M in debt, management’s case shows 5.0x leverage; the lender’s case shows 5.95x, approaching or breaching most middle-market lender thresholds. This is exactly why the EBITDA definition negotiated in the credit agreement is fundamental to the default risk of the loan.
Stress Testing the Normalized Base
After establishing lender-normalized EBITDA of $8.4M, a rigorous underwriter applies at least two stress scenarios before sizing debt:
- Base Downside (–15%): EBITDA = $7.1M. Coverage ratio at 5.0x debt: DSCR falls to approximately 1.05x. Marginal.
- Severe Downside (–25%): EBITDA = $6.3M. Leverage exceeds 7.9x; DSCR below 1.0x. Covenant breach likely.
If either stress scenario results in a DSCR below 1.10x, institutional lenders typically reduce debt sizing, tighten covenants, or require additional equity cushion. Notably, market data confirms that most transactions now clear around 5.0x EBITDA leverage, representing a notable retreat from the 6.0x+ levels prevalent during 2018–2019, with lenders generally resisting extensions beyond 5.5x except for the most creditworthy borrowers.
What Institutional Lenders Know: Industry Data, Standards, and Red Flags
The Covenant-Lite Problem and What It Tells Underwriters
The structural backdrop to all EBITDA underwriting is sobering. According to market data, 91.09% of outstanding U.S. leveraged loans were covenant-lite at year-end 2024, roughly $1.29 trillion in face value. In the broadly syndicated market, 93% of all new institutional leveraged loan issuance in 2024 was covenant-lite, meaning borrowers carry no maintenance tests to fail. For private credit in the lower middle market, the picture is meaningfully different: data from KBRA DLD Research and ABF Journal shows that approximately 98% of lower-middle-market loans with borrower EBITDA below $50 million retain full financial maintenance covenant packages.
This divergence matters because recovery rates tell the story. Cov-lite senior secured debt trails covenanted loans by roughly 10 percentage points, running at 65–67 cents on the dollar versus 75 cents or more for covenanted structures. Moody’s Default Research Database and S&P Global Ratings data both point to the same finding: lenders who can act early, armed with a maintenance covenant, consistently recover more than lenders who discover the problem only at payment default.
For EBITDA underwriters, this means the definition of EBITDA in the covenant is not a boilerplate exercise. It is the primary mechanism through which a lender controls when it receives early warning of deterioration.
Credit Performance Data Box
📊 Key Credit Performance Benchmarks (2024–2026)
- Leveraged Loan Default Rate (conventional payment defaults, LTM Aug 2025): 1.36%, per Pitchbook LCD Distressed Weekly. Combined rate including distressed LMEs: 4.37%, below the December 2024 high of 4.70%, suggesting early stabilization. (Source: Valuation Research Corp. / Pitchbook LCD, Feb 2026)
- Moody’s Projected Leveraged Loan Default Rate: Projected to reach 7.5% by year-end 2025, rising to 7.9% in Q1 2026, nearly double the 3.4% historical average. (Source: Moody’s Ratings, July 2025)
- Cliffwater Direct Lending Index (CDLI) Annualized Credit Loss: Approximately 1.47% for the broader CDLI (senior + non-senior loans to middle-market borrowers), 2017–2025. (Source: Morgan Stanley IM / Cliffwater, 2025)
- First Lien Recovery Rates (S&P historical, U.S. and Canada): Long-term average of 75–80% over 35 years; recent actuals trending below historical averages and declining, consistent with Moody’s commentary on top-heavy capital structures. (Source: S&P Global Ratings, via Bermuda Monetary Authority Deep Dive, Sep 2024)
- Middle-Market Leverage at Closing (2024): Debt-to-EBITDA ratios for U.S. LBOs averaged approximately 4.9x in 2024, remaining well below pre-pandemic peaks; most transactions clear around 5.0x. (Source: Bain & Company / Private Capital Global, Sep 2025)
- Distressed Exchanges as % of All Defaults (H1 2025): Distressed exchanges accounted for 64% of all defaults in the first half of 2025, roughly the same pace as all of 2024, which itself was the highest annual share on record. (Source: Moody’s Ratings, July 2025)
The Most Common Red Flags in EBITDA Add-Back Schedules
- Uncapped pro forma synergies: Sellers sometimes add back the projected EBITDA of a planned acquisition or new product line that has not yet closed. Institutional lenders give zero credit for pro forma add-ons without a track record.
- Vague or recurring “non-recurring” items: If a company has claimed a “one-time” restructuring cost in three of the last four years, it is not non-recurring. Pattern analysis across multiple periods is essential.
- EBITDA growing while cash flow stagnates: If adjusted EBITDA improves quarter-over-quarter but operating cash flow does not follow, that is a signal that improvements are on paper (from accounting changes or timing) not from real operations.
- Overreliance on PIK provisions as a stress signal: When a borrower elects PIK interest rather than cash payment, the loan balance grows and credit metrics deteriorate, all without triggering a covenant. Approximately 10% of BDC interest income was PIK rather than cash as of mid-2024, a figure lenders should monitor as a portfolio-wide stress indicator.
- Founder dependence left unaddressed: In smaller businesses, an owner may be doing the work of two or three managers. Removing their above-market compensation is an add-back; failing to add back the cost of two replacement hires is an underwriting failure.
Underwriting Checklist: EBITDA Normalization Diligence
The following checklist reflects institutional standards for EBITDA diligence in a middle-market direct lending context. Consistent with Federal Reserve Interagency Guidance on Leveraged Lending, lenders must make a thorough, independent evaluation applying the same standards they would use if originating the loan themselves.
- ✅ Obtain 3 years of audited or reviewed financials + LTM financials tied to source documents. Do not rely solely on a CIM-formatted EBITDA bridge. Reconcile to GAAP.
- ✅ Reconstruct reported EBITDA independently from Net Income through the D&A line. Flag any discrepancies versus management presentation.
- ✅ Request bank statements and payroll records for each proposed add-back exceeding $50K. Require supporting invoices or board resolutions for one-time items.
- ✅ Perform pattern analysis across all add-back categories. Has any “non-recurring” item appeared in more than one period? If yes, classify as potentially recurring.
- ✅ Benchmark owner compensation to market. Use third-party compensation surveys for the role, company size, and geography. Apply a replacement cost for any management functions concentrated in the owner.
- ✅ Confirm all related-party transactions at arm’s-length rates. Check rent, management fees, intercompany loans, and service agreements against market comparables.
- ✅ Request maintenance capex schedules. Distinguish between sustaining capex (recurring) and growth capex (discretionary). Do not allow sustaining capex to be excluded from normalized earnings.
- ✅ Reconcile EBITDA to operating cash flow. If the bridge does not flow through to a consistent cash conversion pattern, investigate the delta item by item.
- ✅ Apply a cap analysis to the EBITDA definition in the proposed credit agreement. Confirm that the covenant EBITDA definition is no more expansive than the underwritten EBITDA, and impose aggregate caps on uncapped add-back buckets.
- ✅ Run at least two downside stress scenarios (–15% and –25% from normalized base). If DSCR falls below 1.10x in the base downside, resize debt, tighten covenants, or increase equity.
- ✅ Ask: What does this business look like without the seller? Document the management team depth, key customer relationships, and operational dependencies before accepting any owner-normalization add-backs.
Key Takeaways for Credit Underwriters
- 🔹 The number that drives risk is not reported EBITDA or management’s adjusted EBITDA; it is the EBITDA the lender independently underwrites and can defend to a credit committee under stress. These three figures often diverge materially, and the divergence itself is a data point about the deal.
- 🔹 Unsupported add-backs are a structural risk, not just a valuation disagreement. Because the leverage covenant’s EBITDA definition mirrors the underwritten earnings base, an inflated EBITDA definition in the credit agreement directly reduces the chance that the covenant triggers when the business actually deteriorates.
- 🔹 Downward adjustments are as important as add-backs. Sophisticated lenders make negative adjustments (for sub-market rent, underpaid owners, deferred maintenance, or missing management layers) that sellers routinely omit from their bridge. Ignoring these is an underwriting failure, not a negotiating compromise.
- 🔹 The covenant-lite trend in the broadly syndicated market makes EBITDA underwriting rigor in private credit more, not less, important. Recovery data confirms that covenanted lenders acting early recover 10 percentage points more than those who discover distress only at payment default. For direct lenders holding loans to maturity, the quality of the initial EBITDA underwriting is the primary risk management tool.
- 🔹 EBITDA normalization is not the finish line; it is the foundation. Leverage ratio sizing, covenant cushion, DSCR coverage, and stress scenario performance all depend entirely on the integrity of the earnings base. Get the base right, and every downstream credit decision improves. Accept a management-massaged number, and every metric in the model is wrong from the first line.


