
The Underwriting Problem: A Number That Isn’t What It Appears to Be
A sponsor delivers a Confidential Information Memorandum showing a manufacturing business with $12M in adjusted EBITDA. The debt package is sized at 5.0x, implying $60M in senior secured financing. The model closes. The coverage ratios hold. The deal moves to credit committee.
Then a lender’s analyst begins tracing the add-back schedule: $900K in “one-time” legal fees that have recurred every year for four years. A $750K management fee termination benefit that requires a new executive hire to replace. A $1.2M pro forma cost savings from a restructuring that hasn’t started. And a $400K revenue run-rate adjustment based on a contract signed three weeks before close.
Suddenly the lendable EBITDA, the earnings base a rigorous underwriter would actually finance against, is closer to $9.1M. At 5.0x, the appropriate debt load is $45.5M, not $60M. The gap is not a rounding error. It is a structural overcollateralization risk that will surface during the first covenant test.
This is why EBITDA normalization is not a back-office accounting exercise. It is the analytical engine of credit underwriting, and the discipline that most directly determines whether a lender is protected or exposed at the moment a borrower hits stress.
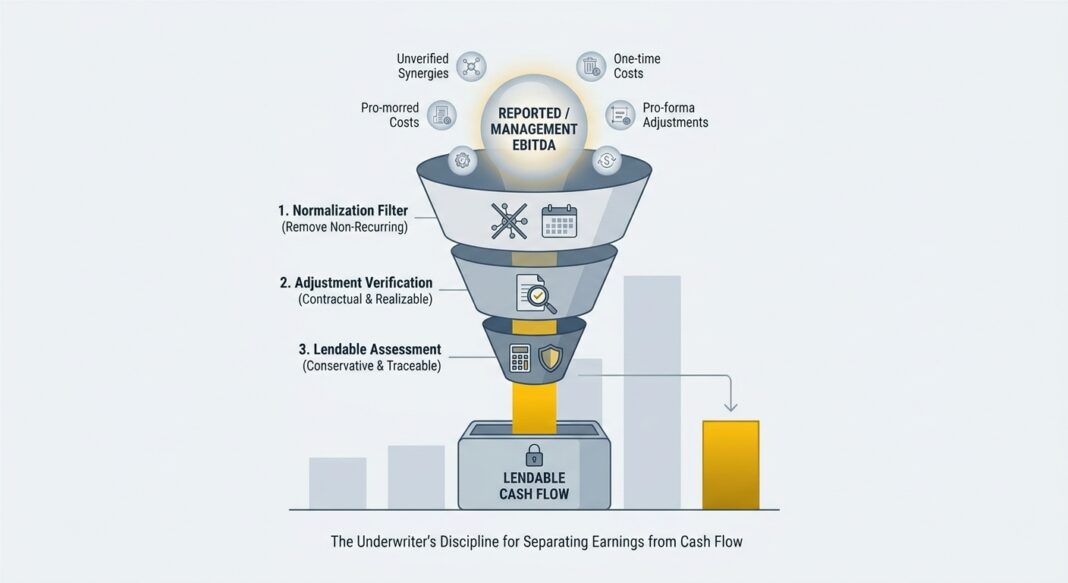
The Analytical Framework: From Reported to Lendable EBITDA
EBITDA normalization follows a structured, three-layer process. Each layer asks a progressively harder question about the durability and verifiability of reported earnings.
Layer 1: Reported to Normalized EBITDA
Begin with audited financials, not the CIM. Normalized EBITDA is a historical earnings figure after removing non-recurring, non-operating, unusual, or owner-specific items so the business can be evaluated on a representative earnings base. This step is mechanical: identify items that are real in the historical record but will not repeat post-close. Classic examples include a prior-year insurance recovery, a one-time lease termination gain, or litigation proceeds.
Layer 2: Normalized to Adjusted EBITDA
Adjusted EBITDA is often used more broadly to describe the earnings figure buyers, lenders, and advisors use in underwriting, which may include normalization adjustments as well as other deal-specific or pro forma considerations. This is where the discipline gets harder. Pro forma synergies, run-rate cost savings, and acquisition-related adjustments are added here, and each requires independent verification. A lender must ask: has the restructuring actually commenced? Is the cost savings contractually locked? Are the projected synergies achievable within a defined operational timeline?
Common add-backs that are more highly negotiated include restructuring and integration costs, transaction expenses, extraordinary or nonrecurring losses, pro forma synergies, run-rate adjustments, and company- or industry-specific items such as costs associated with new locations or research and development.
Layer 3: Adjusted to Lendable EBITDA
This is the lender’s number, not management’s, not the sponsor’s. Lenders are usually cautious, and they will only consider adjustments that can be clearly justified and traced back to the company’s financial statements. Items that cannot be documented with third-party evidence, recurring patterns, or forward contracts are removed entirely. Lenders often use the most conservative EBITDA definition because it drives debt sizing, covenants, and repayment capacity.
Example, $12M Adjusted EBITDA Manufacturing Business:
- Reported EBITDA (audited): $9.8M
- Add: Owner compensation above market rate: +$600K (verified via comp study)
- Add: Non-recurring legal settlement: +$400K (one-time, documented)
- Add: Pro forma cost savings from ERP implementation: +$750K, REJECTED: not yet operational
- Add: M&A synergies from tuck-in acquisition: +$450K, PARTIALLY ACCEPTED: $225K verified, $225K projected
- Lendable EBITDA: ~$10.6M vs. Management’s Presented $12M
The $1.4M gap, 11.7% of presented EBITDA, compresses the lendable debt at 5.0x by $7M. That is not a rounding error. That is a structurally over-levered deal.
Walking Through the Calculations: How Add-Back Quality Shapes Credit Metrics
EBITDA normalization directly governs three of the most critical credit metrics: total leverage, interest coverage, and fixed charge coverage. Underwriters must calculate each metric using both management’s EBITDA and their own lendable EBITDA figure to understand the true risk gap at close.
Key Metrics Across EBITDA Definitions (illustrative $60M debt, 8.5% PIK/cash blended rate):
| Metric | Management EBITDA ($12M) | Lendable EBITDA ($10.6M) | Institutional Floor |
|---|---|---|---|
| Total Net Leverage | 5.0x | 5.66x | 5.5x–6.0x (first lien covenant) |
| DSCR (EBITDA ÷ Debt Service) | 1.71x | 1.51x | 1.50x minimum downside floor |
| FCCR (post-capex, post-tax) | 1.32x | 1.17x | 1.10x–1.25x covenant floor |
Illustrative figures for analytical framework only. Not actual borrower data.
On management’s numbers, the deal appears to pass every institutional threshold. On lendable EBITDA, the FCCR slips below the standard 1.25x covenant floor before the first quarterly test has been administered. The underwriter who accepted the presented number originated a credit that is technically in breach at close.
A Quality of Earnings analysis commonly evaluates revenue recognition, customer concentration, revenue quality, gross margin trends, add-back support, reserves, accounting cutoffs, working-capital behavior, cash conversion, and the relationship between EBITDA and cash flow. Its purpose is not to verify arithmetic, it is to determine whether the earnings base used in valuation is accurate, repeatable, and financeable.
The final diagnostic: reconcile EBITDA to operating cash flow. If EBITDA goes up but the company is not bringing in more cash from its regular operations, that could mean the improved earnings are just on paper, from accounting changes or timing differences and not real growth. When EBITDA expands while free cash flow contracts, the adjustment schedule has almost certainly been over-engineered.
Industry Standards: What Institutional Lenders Require in 2026
The FSB’s May 2026 review of private credit vulnerabilities confirmed that EBITDA adjustment practices remain a central structural concern across the asset class. The use of adjustments is not unique to private credit and has been observed in other corporate lending such as in the leveraged market, and while some cases may be warranted to reflect genuine cost savings or synergies from a merger, research has shown that many projected add-backs do not materialize as forecast.
Because expansive add-backs can materially affect leverage outcomes, lenders often impose caps (including shared caps expressed as a percentage of EBITDA on certain projection-based or nonrecurring adjustments) time-based restrictions, or other limitations in an attempt to reflect actual operating cash flows. These caps commonly limit total projected or non-cash add-backs to 15%–25% of the underlying reported EBITDA.
The credit performance data reinforces why precision in EBITDA normalization is a lender protection imperative, not merely an accounting preference:
📊 Credit Performance Data Box
- Leveraged loan default rate (Moody’s, as of Q2 2026): Projected at approximately 7.3%, more than double the 3.4% long-term historical average. [Moody’s, July 2025]
- Moody’s leveraged loan recovery rate: Approximately 60%, implying an annual credit loss of roughly 2.8% at elevated default rates. [Capra Ibex / Moody’s data]
- Conventional payment default rate (U.S. leveraged loans, trailing 12-month as of August 2025): 1.36%; combined default rate including distressed liability management exercises (LMEs) reached 4.37%. [Valuation Research Corp / PitchBook LCD]
- Private credit default rates by borrower EBITDA size (J.P. Morgan / Proskauer, 2025): Borrowers with EBITDA of $25M–$50M defaulted at 3.38% in 2025, versus 1.44% for borrowers with EBITDA above $50M, confirming that smaller, less-diversified credits carry meaningfully higher default risk. [J.P. Morgan Private Bank, March 2026]
- Private credit CLO loan quality: Private credit CLOs tend to include a higher proportion of CCC-rated loans, a lower weighted average portfolio rating, and weaker recovery rates compared to traditional balance-sheet CLOs. [FSB, May 2026]
- Realized loss rate: The historical realized loss rate for private credit first lien portfolios is approximately 1% annually over the last two decades. [Heron Finance / Q2 2026 Benchmark Report]
These figures carry a direct structural implication: when EBITDA is overstated, leverage is understated, covenants are set at the wrong threshold, and recovery modeling is built on a false collateral base. Inflated EBITDA is not merely an analytical error; it is a loss event waiting for a trigger.
Sophisticated lenders respond to this environment with increased selectivity. Other underwriting factors that should be considered include less cyclical industries, companies with stable or growing free cash flow, durable competitive advantages, strong management teams, and sponsors or owners with a record of supporting their businesses. EBITDA normalization does not operate in isolation; it is one layer of a broader credit quality framework.
The private credit market entering mid-2026 rewards that discipline directly. A more active market gives lenders more to choose from, but stronger deal flow is only helpful if a manager has the ability and discipline to say no.
The EBITDA Normalization Underwriting Checklist
Before accepting any adjusted EBITDA figure in credit underwriting, a rigorous lender should confirm the following:
- Source the base: Is the EBITDA bridge built from audited financial statements or management accounts? Require a three-year trailing average alongside the LTM figure. Seasonality and cyclicality must be visible in the history.
- Trace every add-back to documentation: Each adjustment requires a supporting schedule. One-time legal costs need docket records and counsel confirmation. Owner compensation adjustments require a market comp study. No undocumented add-backs survive the credit memo.
- Classify add-backs by realizability: Separate (a) already-realized adjustments, (b) contractually committed adjustments, and (c) projected/run-rate adjustments. Only category (a) and conservatively sized (b) belong in lendable EBITDA. Category (c) requires a haircut of 50%–100%.
- Apply a recurrence test: If an item described as “non-recurring” appears in more than one of the last three fiscal years, it is recurring. Reclassify and exclude.
- Cap total unverified adjustments: In line with institutional practice, total projected and non-cash add-backs should not exceed 15%–20% of reported EBITDA without heightened scrutiny and independent QoE confirmation.
- Reconcile to cash flow: Run EBITDA against operating cash flow from the cash flow statement. Divergence of more than 15%–20% signals a working capital problem, aggressive revenue recognition, or unsupported adjustments.
- Stress test the lendable number: Apply a 15%–20% haircut to lendable EBITDA and recalculate leverage, DSCR, and FCCR. If any metric breaches institutional floors under this single-step stress, restructure the deal before approval, not after the first quarterly test.
- Commission an independent QoE: For any transaction above $20M in total debt, an independent quality of earnings report from a third-party accounting firm is not optional. Adjustments identified in sponsor models or QoE reports should be independently reconciled, not accepted at face value. [Sidley Austin, March 2026]
- Set covenants off lendable EBITDA, not management EBITDA: Covenant thresholds set against inflated EBITDA create false headroom. The leverage covenant must reflect the earnings base a lender has independently verified, not the earnings base the sponsor underwrote.
Key Takeaways
- The earnings gap is the risk gap. The spread between management’s adjusted EBITDA and a lender’s independently verified lendable EBITDA is a direct proxy for structural credit risk. In middle-market transactions, this gap frequently ranges from 10% to 25% of the presented figure, a difference that can shift a deal from safely structured to technically distressed at close.
- Add-backs must survive a documentation test, not just a narrative test. Every adjustment requires traceable, third-party verifiable evidence. Projected synergies, run-rate savings, and future cost eliminations that cannot be confirmed with contracts, operational plans, or actualized data belong in zero, not in lendable EBITDA.
- Lendable EBITDA governs debt sizing, covenant design, and recovery modeling simultaneously. Accepting an overstated earnings figure does not merely affect the opening leverage ratio; it sets the wrong baseline for every financial covenant, every interest coverage calculation, and every collateral recovery scenario for the life of the loan.
- The current default environment demands greater normalization discipline, not less. With leveraged loan default rates elevated well above historical averages and liability management exercises distorting conventional default measurement, the consequences of structurally over-levered deals, built on unverified EBITDA, are being realized in real portfolios in 2025 and 2026.
- EBITDA normalization is the beginning of credit underwriting, not the conclusion of it. A defensible lendable EBITDA figure is the prerequisite for stress testing, covenant design, and collateral sizing. It does not replace them. Rigorous lenders build the full analytical structure (scenarios, covenants, and recovery analysis) on top of an earnings base they have independently verified and are prepared to defend in a credit committee.


