
The Underwriting Challenge: Which EBITDA Are You Actually Lending Against?
Every credit decision at Bond Capital begins with a deceptively simple question: How much does this business actually earn? The answer is rarely the number on the first page of the CIM.
In middle-market credit, reported EBITDA is only a starting point. Buyers and advisors almost always analyze whether the company’s earnings need to be adjusted to reflect how the business actually operates on a normalized basis and how a buyer is likely to underwrite the company after closing. That analysis, the normalization of earnings, is where credit decisions are made or broken.
The stakes are high. EBITDA adjustments can materially affect valuation because enterprise value is often derived by applying a multiple to the earnings figure the market accepts, and that figure directly drives debt sizing, interest coverage ratios, and covenant headroom. A lender who accepts an inflated adjusted EBITDA is underwriting a leverage ratio that doesn’t exist. In today’s environment, where lenders are tightening underwriting standards and distress is rising, the cost of that mistake is measured in restructurings and realized losses, not renegotiated LOIs.
This article walks through Bond Capital’s analytical framework for EBITDA normalization: how we build the earnings bridge, which adjustments survive diligence, and what red flags trigger immediate scrutiny.
The Analytical Framework: Building a Defensible Earnings Bridge
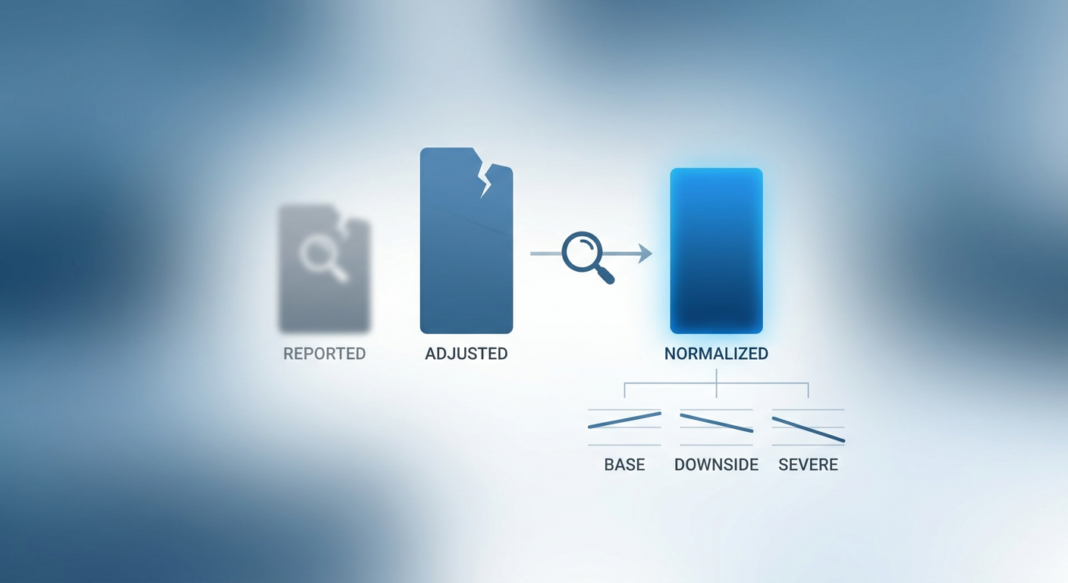
Experienced lenders distinguish carefully between three versions of EBITDA that circulate in any deal process:
- Reported EBITDA: The number on the financial statements, prepared under GAAP or management accounts. This is the floor of the analysis, not the conclusion.
- Adjusted EBITDA: The earnings figure buyers, lenders, and advisors use in underwriting, which may include normalization adjustments as well as other deal-specific or pro forma considerations. This is management’s proposed add-back schedule.
- Normalized EBITDA: A buyer-underwritable estimate of sustainable, recurring operating earnings. It starts with reported EBITDA, removes non-recurring, non-operating, and owner-specific items, and then adjusts for supportable run-rate effects that a buyer or lender can reasonably rely on. This is what Bond Capital actually lends against.
The gap between adjusted and normalized EBITDA is where credit risk lives. Adjusted EBITDA usually starts with management’s add-backs, while normalized EBITDA reflects the adjustments that survive diligence and support a repeatable run-rate.
The Five-Step Normalization Process
- Start with reported EBITDA. Pull three years of audited or reviewed financials plus the trailing twelve months (TTM). Build a quarterly view to identify seasonality, trend, and anomalies.
- Apply and document each add-back. In a formal business appraisal, the appraiser applies normalization adjustments to EBITDA following AICPA and ASA standards, producing a documented, defensible adjusted EBITDA that satisfies IRS audit scrutiny and lender underwriting requirements. Bond Capital applies the same evidentiary standard to every line item.
- Challenge downward adjustments. Sellers add back expenses to increase EBITDA; buyers sometimes make downward adjustments to remove one-time revenue or non-recurring income that inflated the seller’s trailing results, reducing adjusted EBITDA below the reported figure. Both directions matter.
- Reconcile to operating cash flow. It’s essential to compare EBITDA to actual cash flow. If the numbers don’t match up, that’s a sign that something might be off. A QoE ratio (operating cash flow ÷ net income) below 1.0x is a structural red flag.
- Stress-test the run rate. Apply base, downside, and severe downside scenarios to normalized EBITDA before sizing debt and setting covenants.
Example: Analyzing a $10M EBITDA Manufacturing Company
A sponsor presents a $42M enterprise value on a manufacturer reporting $10M EBITDA at a 4.2x multiple. The adjusted EBITDA schedule shows $12.5M after add-backs. Here is how Bond Capital builds the bridge:
| Item | Amount | Bond Capital Assessment |
|---|---|---|
| Reported EBITDA | $10,000,000 | Baseline, verified to financials |
| Owner excess compensation add-back | +$800,000 | Accepted: supported by comp survey |
| One-time legal settlement | +$400,000 | Accepted: documented, non-recurring |
| COVID-era PPP loan income | +$600,000 | Rejected: non-operational revenue |
| “Projected” cost savings (unachieved) | +$700,000 | Rejected: pro forma without execution history |
| Below-market related-party rent | −$250,000 | Downward adj.: market-rate adjustment required |
| Bond Capital Normalized EBITDA | $11,250,000 | 4.2x EV/EBITDA on a real basis → underwritable |
The sponsor’s $12.5M adjusted figure shrinks to $11.25M under independent review: a $1.25M difference that, at a 5x leverage multiple, reduces available debt capacity by $6.25M and may require additional equity to close the deal.
The Analysis: Walking Through Calculations and Identifying Issues
Key Metrics Every Lender Must Calculate
Once normalized EBITDA is established, the following ratios form the core credit scorecard:
- Total Leverage (Debt / Normalized EBITDA): The primary sizing constraint. According to PGIM, as of September 30, 2024, middle market first-lien debt averaged 4.5x leverage (debt to EBITDA), compared to 5.8x in the broadly syndicated loan market. Bond Capital benchmarks total leverage against sector peers and stress tests to 6.5x+ scenarios.
- Interest Coverage (EBITDA / Cash Interest): Tests whether cash earnings cover debt service. Coverage below 1.5x on a normalized basis is a structural warning sign in any underwriting model.
- Debt Service Coverage Ratio (DSCR): DSCR measures how much cash flow is available to cover loan payments. It is typically calculated using normalized cash flow after accounting for taxes, capex, and working capital requirements, not EBITDA alone.
- QoE Ratio (Operating Cash Flow / Net Income): A QoE ratio below 1 suggests that net income isn’t fully supported by cash flow, raising concerns about the sustainability of the company’s profits.
Stress Testing the Earnings Base
Bond Capital runs three scenarios on every normalized EBITDA figure before credit committee:
- Base Case: Normalized EBITDA holds flat; assess leverage and coverage at current debt levels.
- Downside (−15% EBITDA): Reflects mild revenue contraction or margin compression. Does interest coverage remain above 1.25x? Does leverage breach the covenant threshold?
- Severe Downside (−30% EBITDA): Reflects a recession scenario or customer concentration event. Can the borrower service debt without breaching incurrence covenants? Is the collateral package sufficient to recover par?
If EBITDA normalization is overly aggressive, DSCR may appear acceptable on paper but fail during underwriting, one of the most common reasons deals stall or collapse. The stress test is the lender’s last line of defense before commitment.
Industry Standards: What Institutional Lenders Look For
The Current Credit Environment
Lenders operating in 2025–2026 face a challenging backdrop that makes earnings quality scrutiny more critical than ever:
- The leveraged loan default rate is projected to end the year at 7.5%, rise to 7.9% in Q1 of 2026, and touch 7.3% in Q2 2026, more than double the 3.4% historical average. (Moody’s, July 2025)
- High-yield bond issuers are projected to see a realized default rate of 3.2% for calendar year 2025, rising to above 4% by Q1 2026. (Moody’s, July 2025)
- According to Fitch, the U.S. private credit default rate climbed to 5.7% by early 2025, up from virtually 0% in 2022.
- Distressed exchanges accounted for 64% of all defaults in the first half of 2025, the highest annual share on record. This means borrowers are restructuring before traditional default triggers are hit. (Moody’s, July 2025)
- Roughly 30% of the distressed restructurings in 2024 were from three sectors: healthcare/pharmaceuticals, business services, and high-tech industries, sectors that also tend to carry the most aggressive EBITDA add-back schedules. (Moody’s)
📊 Data Box: Credit Risk Benchmarks (2025–2026)
| Leveraged Loan Default Rate (Moody’s Forecast) | 7.5% – 7.9% (YE 2025 – Q1 2026) |
| HY Bond Default Rate (Moody’s) | 3.2% (2025) → >4% (Q1 2026) |
| U.S. Private Credit Default Rate (Fitch) | 5.7% (early 2025) |
| Covenant-Lite Institutional Loans Outstanding | 91.1% of market (~$1.29T face value, YE 2024) |
| New Issuance Cov-Lite (2024) | 93% of all new institutional leveraged loan issuance |
| Distressed Exchanges as % of Defaults (H1 2025) | 64%, highest annual share on record |
Sources: Moody’s Credit Strategy US Report, July 2025; Resonanz Capital, Covenant Analysis 2024–2025; Angel Investors Network / Preqin Private Credit Market 2025
Common Red Flags in EBITDA Normalization
Experienced underwriters treat the following as automatic triggers for deeper diligence or adjustment haircuts:
- The EBITDA Bridge is Wider Than 20%. When the gap between reported and adjusted EBITDA exceeds 20%, every add-back requires independent documentation. The bridge between Reported and Adjusted EBITDA is no longer just a meme-worthy punchline, it’s a red flag in the eyes of investors and diligence teams that needs to be proactively addressed.
- Pro Forma Synergies Without Execution History. For the more complex pro forma adjustments, buyers expect not only robust supporting evidence but also a demonstrated history of successful execution of similar cost reduction or operational improvement initiatives.
- Customer Concentration. Any customer contributing over 10% of revenue is a clear QoE red flag. It must be stress-tested for loss or renegotiation in the downside scenario.
- Proof-of-Cash Gaps. Discrepancies between reported revenue and actual bank deposits are an immediate escalation item and potential fraud indicator.
- Unrecorded Liabilities. Accrued vacation, deferred warranty obligations, and contingent environmental liabilities that do not appear in EBITDA but do represent future cash outflows.
- Cov-Lite Capital Structure Requests. In a market where 91.09% of outstanding U.S. leveraged loans were covenant-lite at year-end 2024, the absence of financial maintenance covenants means lenders have no early warning mechanism when earnings deteriorate, making initial normalization accuracy even more critical.
Bond Capital Underwriting Checklist: EBITDA Normalization Diligence
Before any credit committee presentation, the following diligence points must be completed and documented:
Step 1: Obtain and Verify Source Financials
- ☑ Three years audited/reviewed financials + TTM management accounts
- ☑ Quarterly P&L to identify seasonality and one-time events
- ☑ Tax returns cross-referenced against financial statements (identify discrepancies)
- ☑ Bank statements reconciled to reported revenue (“proof of cash”)
Step 2: Build and Challenge the Add-Back Schedule
- ☑ Request seller’s full add-back schedule with supporting documentation for every line item
- ☑ Apply AICPA/ASA normalization standards, every adjustment must be documented and defensible
- ☑ Independently verify owner compensation against market replacement salary data
- ☑ Test related-party transactions (rent, management fees, intercompany) against arm’s-length market rates
- ☑ Remove pro forma synergies lacking demonstrated execution history
Step 3: Revenue Quality and Cash Conversion Analysis
- ☑ Analyze revenue by customer, contract type, and recurrence (recurring vs. project-based vs. one-time)
- ☑ Flag any customer >10% of revenue for concentration stress test
- ☑ Calculate QoE ratio: Operating Cash Flow ÷ Net Income (flag if <1.0x)
- ☑ Review AR aging, stale receivables inflate revenue and distort working capital
Step 4: Debt Capacity and Covenant Sizing
- ☑ Calculate leverage, interest coverage, and DSCR on normalized EBITDA (not adjusted)
- ☑ Run base / −15% / −30% stress scenarios on normalized EBITDA
- ☑ Size covenants with sufficient headroom for downside scenario (minimum 20–25% cushion)
- ☑ Document any cov-lite request and its implication for early-warning monitoring
Step 5: Documentation and Credit Committee Package
- ☑ Prepare a clean EBITDA bridge: Reported → Adjusted → Normalized, with each line supported
- ☑ Include independent QoE report from a credentialed third-party accounting firm
- ☑ Summarize red flags identified, how they were resolved, and residual risk
- ☑ Document final normalized EBITDA figure and the basis for each accepted/rejected add-back
Key Takeaways: Five Risk Management Insights
- Adjusted EBITDA is management’s opening bid, not your lending basis. The normalized figure that survives independent diligence is the only number that belongs in a credit model. Lenders are usually cautious, and they’ll only consider adjustments that can be clearly justified and traced back to the company’s financial statements, because that figure drives debt sizing, covenants, and repayment capacity.
- Cash conversion is the acid test of earnings quality. Any business reporting growing EBITDA without corresponding operating cash flow generation deserves immediate scrutiny. A QoE ratio persistently below 1.0x signals accrual manipulation, aggressive revenue recognition, or working capital deterioration that EBITDA-only analysis will miss.
- Pro forma add-backs without execution history are credit risk in disguise. The most dangerous add-backs are those representing “future” savings that have not materialized. Buyers increasingly expect Adjusted EBITDA to connect directly to sustainable free cash flow and demonstrated cost savings that reflect business reality. Lenders must hold the same standard, or absorb the variance when reality underdelivers.
- Covenant-lite structures amplify normalization risk. When 93% of all new institutional leveraged loan issuance was covenant-lite in 2024, lenders lose the early warning mechanisms that historically flagged deteriorating credit before default. The accuracy of initial EBITDA normalization becomes the only underwriting protection a lender has. Getting it wrong at origination means finding out about the problem when the borrower misses a payment.
- Sector concentration in distress is not coincidental. Roughly 30% of the distressed restructurings in 2024 came from healthcare/pharmaceuticals, business services, and high-tech industries, sectors where EBITDA add-backs (R&D capitalization, deferred revenue, management fee eliminations) are most prevalent. Sector-specific normalization expertise is a material underwriting edge, not an optional refinement.


