
The Buffer Between You and a Loss
When a private credit lender extends a senior secured loan to a middle-market company, the single most important structural safeguard is not the interest rate or the covenant package; it is the equity cushion. This is the layer of capital contributed by a private equity sponsor that sits below the debt in the capital stack, absorbing losses before the lender’s principal is ever at risk.
Understanding how equity cushions work (and how to evaluate their real protective power) is foundational for anyone deploying capital into or borrowing from the private credit market. In mid-2026, with bank lending standards tightening for the third consecutive year and direct lending spreads beginning to widen off their lows, the quality of the equity cushion protecting a loan has never been more scrutinized.
This article explains what the equity cushion is, how it is measured through loan-to-value (LTV) ratios, why headline LTV can sometimes be misleading in middle-market lending, and how to use these metrics as a practical decision framework, whether you are an institutional investor evaluating a private credit fund or a business owner structuring a financing.
What Is an Equity Cushion and How Does It Work?
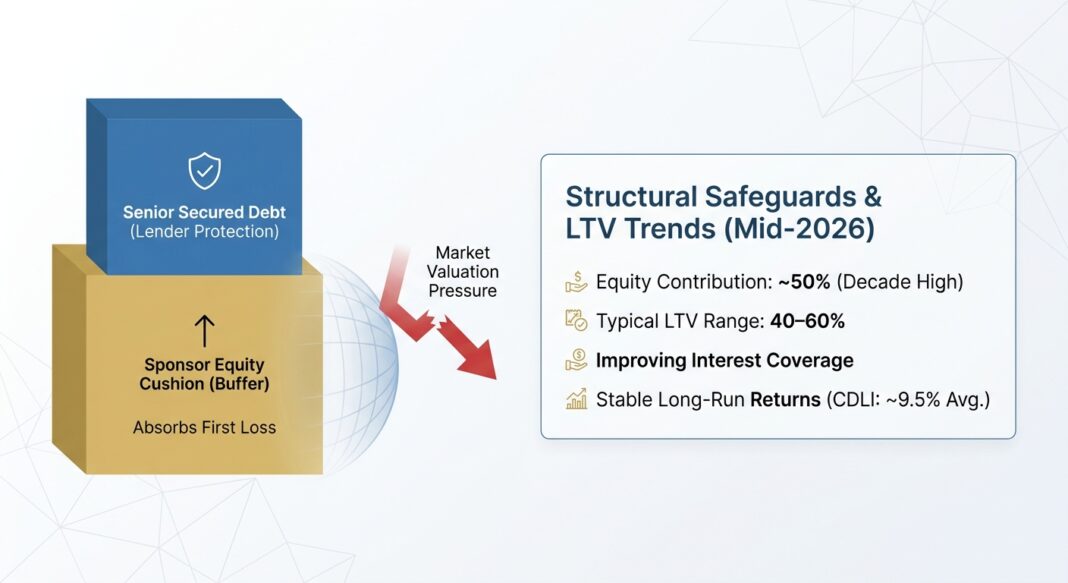
In a leveraged buyout (LBO) or sponsored financing, the total purchase price of a company is funded by two sources: debt (provided by lenders) and equity (contributed by the private equity sponsor). The equity sits at the bottom of the capital stack. If the business deteriorates and value must be recovered, lenders are paid first; equity holders absorb losses first.
The loan-to-value ratio (LTV) quantifies this relationship. It measures the outstanding loan balance as a percentage of the total enterprise value of the borrower:
LTV = Loan Amount ÷ Enterprise Value
A 50% LTV means that the lender’s claim represents half of the company’s assessed value, and the remaining 50% is equity that must be wiped out before the loan faces impairment. The higher the equity contribution, the lower the LTV, and the greater the protection for the lender.
Private credit direct lending is a senior secured strategy. As noted by LPL Research (March 2026), these loans are typically senior in the capital structure, meaning lenders hold the first claim on borrower assets in a default scenario: a combination of seniority, collateralization, and floating-rate income that has made direct lending particularly attractive to institutional investors.
An important nuance: in middle-market corporate lending, the “collateral” is rarely a hard asset like a building. It is the company’s earning power: its EBITDA, customer contracts, and competitive position. Unlike a mortgage lender who can foreclose on a property, a private credit lender’s cushion rests on a valuation multiple applied to a stream of cash flows. Both the multiple and the cash flow can compress simultaneously in a downturn.
A Concrete Example: Running the LTV Math
Consider a private equity firm acquiring a software-adjacent manufacturing company for a total enterprise value of $100 million at a purchase price multiple of 10x EBITDA (implying $10 million in annual EBITDA). The deal is financed as follows:
- Senior Secured Unitranche Loan: $50 million (provided by a direct lender)
- Sponsor Equity: $50 million (contributed by the PE firm)
The LTV at origination is 50%. The leverage ratio (Debt ÷ EBITDA) is 5.0x. The lender has a $50 million equity cushion standing between it and any credit loss.
Now model a stress scenario: EBITDA contracts by 20% to $8 million due to a revenue slowdown. The market re-rates the business from 10x to 8x EBITDA (a reasonable valuation compression). Enterprise value falls to $64 million. LTV rises to 78%. The equity cushion has shrunk from $50 million to $14 million, still intact, but materially eroded.
In a severe scenario where EBITDA drops 35% and the multiple compresses to 7x, enterprise value falls to approximately $45.5 million, and the lender is now underwater by $4.5 million. This illustrates the critical point: the equity cushion’s real durability depends not just on the initial LTV, but on the stability of the underlying earnings and the valuation multiple at which the market will clear the business.
This is why leverage ratio (Debt/EBITDA) is a companion metric to LTV. It measures how many years of earnings are required to repay the debt and does not depend on what another buyer is willing to pay for the business.
Current Market Reality: Data Points That Matter in Mid-2026
The equity cushion story in private credit has evolved meaningfully over the past decade, and current market data reveals both reassuring structural trends and emerging stress signals worth monitoring.
Equity contributions have grown substantially. According to Partners Group (May 2026), the average LBO equity contribution at origination has increased from approximately 35% in 2013 to around 50% today, meaning private credit lenders in sponsored transactions now benefit from materially larger cushions than a decade ago. Non-accrual rates have correspondingly declined to approximately 1.3% of cost in Q4 2025.
LTV ranges in practice. As documented by LPL Research (March 2026), private credit loans in sponsored transactions typically carry LTV ratios in the range of 40–60%, with private equity sponsors contributing substantial equity of 40–60% or more of deal value. This creates a meaningful buffer that must be significantly eroded before senior debt faces material impairment.
Interest coverage is improving. Partners Group (May 2026) reports that the share of riskier borrowers with sub-1.0x interest coverage has declined from 21–23% in 2023 and early 2024 to 14% in Q4 2025, supported by lower policy rates and healthy EBITDA growth.
The CDLI’s long-run track record. According to Cliffwater (March 31, 2026), the Cliffwater Direct Lending Index (CDLI) returned 9.3% for calendar year 2025, with interest income of 10.4%. The index has now delivered 20 years of returns averaging approximately 9.5%, with only one negative year (2008), a testament to how senior position combined with equity cushion protection has historically preserved capital.
Bank tightening is a structural tailwind. The Federal Reserve April 2026 SLOOS reported that banks tightened lending standards for C&I loans across all firm sizes in Q1 2026, and tightened all terms surveyed on loans to non-depository financial institutions, reinforcing the structural gap that private credit lenders are positioned to fill.
Spreads are resetting higher. Lord Abbett (June 2026) notes that spreads have widened by roughly 50–100 basis points since late 2025, and new loans are increasingly coming with better credit structures: less leverage, more covenants, and tighter documentation, a structurally more favorable environment for lenders focused on downside protection.
| Metric | Reading | Source |
|---|---|---|
| Avg. LBO equity contribution at origination (2026) | ~50% | Partners Group, May 2026 |
| Typical direct lending LTV range (sponsored) | 40–60% | LPL Research, March 2026 |
| CDLI 2025 full-year return | 9.3% | Cliffwater, March 31, 2026 |
| CDLI 20-year average annual return | ~9.5% | Cliffwater, March 31, 2026 |
| Borrowers with sub-1.0x interest coverage (Q4 2025) | 14% (down from 21–23% in 2023) | Partners Group, May 2026 |
| Direct lending spread widening since late 2025 | ~50–100 bps (new issue) | Lord Abbett, June 2026 |
Decision Framework: What This Means for Investors and Operators
For Investors Evaluating Private Credit Funds
When reviewing a direct lending fund’s portfolio, investors consider equity cushion and LTV as primary indicators of downside protection, but effective due diligence looks beyond the headline number:
- Ask for weighted average LTV across the portfolio, not just a range. A fund with an average LTV of 45% offers materially different protection than one at 60%, especially in a valuation compression environment.
- Pair LTV with leverage (Debt/EBITDA). An LTV of 50% looks sound, until you discover the underlying EBITDA is based on highly adjusted, forward-looking projections. Per the FSB’s May 2026 vulnerability report, typical “true” leverage in private credit could be closer to 7x debt-to-EBITDA once adjustments are scrutinized, a meaningful consideration when modeling stress scenarios.
- Assess coverage ratios alongside LTV. A company generating strong, stable EBITDA with a 2.5x interest coverage ratio is a fundamentally different credit risk than one with 1.1x coverage, even if both carry a 50% LTV.
- Evaluate sponsor quality. Equity cushions are only as reliable as the sponsor’s willingness and ability to support the business through difficulty. Experienced sponsors with strong track records and adequate dry powder are more likely to inject additional equity or facilitate an orderly resolution rather than walking away.
For Business Owners and Operators Seeking Capital
Understanding LTV dynamics helps operators structure financings that maximize proceeds while preserving borrower optionality:
- Higher equity contributions unlock better loan terms. Lenders competing for well-structured deals (with strong equity cushions, clean EBITDA, and durable cash flows) continue to offer more competitive pricing, as Lord Abbett (June 2026) notes that lending activity remains competitive for higher-quality deals even in today’s more cautious environment.
- EBITDA quality drives enterprise value, and therefore your equity cushion. Operators who can demonstrate recurring, contract-backed revenue and consistent margin profiles will be underwritten at higher multiples, preserving the equity buffer that keeps a loan from becoming distressed.
- Lower-middle market borrowers often retain more lender-friendly protections. Per PineBridge Investments (February 2026), companies in the lower middle market, typically those with EBITDA up to $30 million, tend to access financing with stronger structural characteristics and more tailored lender relationships, which can be advantageous during periods of stress.
Key Takeaways
- The equity cushion is the primary structural defense in senior secured private credit. In a sponsored transaction, the PE firm’s equity contribution, which has grown to roughly 50% of deal value at origination, must be fully eroded before a senior lender faces principal loss.
- LTV measures the cushion; leverage measures the strain. Both metrics must be evaluated together. A low LTV with high Debt/EBITDA can indicate a structurally fragile deal where cash flows are barely covering interest and enterprise value is highly sensitive to EBITDA compression.
- In middle-market lending, “collateral” is enterprise value, not hard assets. Earnings multiples and cash flows can compress simultaneously in a downturn, which means the equity cushion’s real protection depends on the stability and quality of the underlying business, not just a static ratio at origination.
- Current market data is constructive for lenders. The CDLI returned 9.3% in 2025, equity contributions at origination are near decade highs, and interest coverage for stressed borrowers is improving, even as bank tightening and spread widening are creating a structurally more attractive entry environment for disciplined private credit investors.
- Operators with durable, recurring cash flows and clean EBITDA access the best terms. In a market where lenders are increasingly focused on credit structure quality over yield chasing, the most creditworthy borrowers (those with strong equity support and stable earnings) continue to benefit from competitive financing.


